Padre Cocha Weather & Climate: Best Time to Visit
The climate in Padre Cocha, Loreto, Peru, is remarkably consistent, with temperatures year-round averaging 31°C (88°F). The warmest month is September at 32°C (90°F), and the coolest is July at 30°C (86°F).
Rainfall is high, totalling around 2929 mm (115 in) per year. April is the wettest month and August the driest. August is the sunniest month, averaging 7.6 hours of sunshine per day.
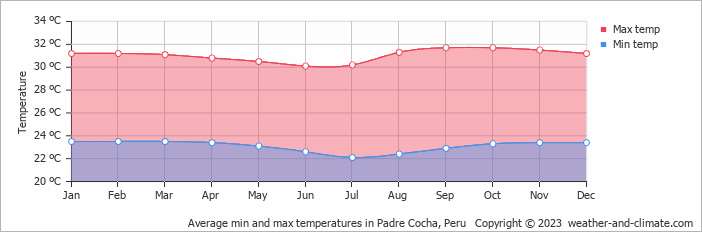
Monthly Temperature in Padre Cocha
In Padre Cocha temperatures are generally consistent throughout the year. Average maximum daytime temperatures range from a very warm 32°C (90°F) in September, the warmest time of the year, to a very warm 30°C (86°F) during cooler months like July.
At night, you can expect temperatures ranging from 24°C (75°F) in September to around 22°C (72°F) during July.
Check out our detailed temperature page for more information.
Temperature ranges by month
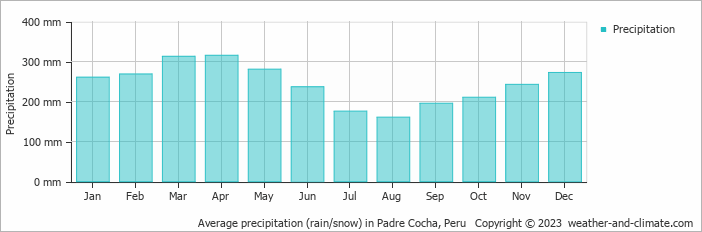
Rainfall in Padre Cocha
Padre Cocha experiences significant rainfall throughout the year, averaging 2929 mm (115 in) of precipitation annually. While rainfall varies throughout the year, each season offers its own charm. April brings wetter days averaging 315 mm (12 in) of precipitation, spread over 20 rainy days.
In contrast, the driest month August experiences a drier climate, with about 160 mm (6.3 in) of rainfall spread across 16 rainy days. For more details, please visit our Padre Cocha Precipitation page.
The mean monthly precipitation over the year, including rain, hail, and snow
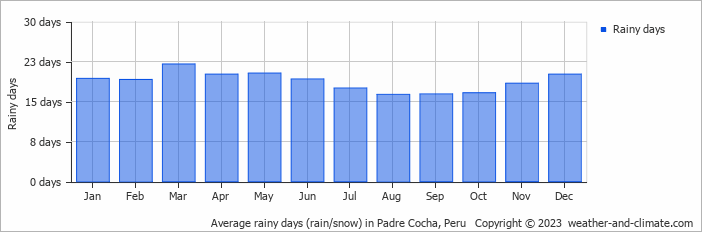
The average number of days each month with precipitation
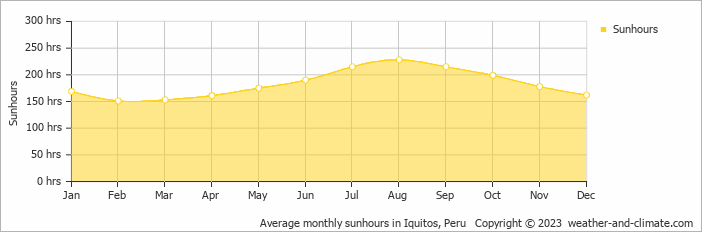
Sunshine Hours in Padre Cocha
While the amount of sunshine in Padre Cocha varies throughout the year, all seasons offer their own charm. Enjoy up to 7.6 hours of daily sun in August, and experience slightly darker atmosphere in February, with about 5.0 hours of daily sunlight.
Visit our detailed sunshine hours page for more information.
Monthly hours of sunshine
Daily hours of sunshine
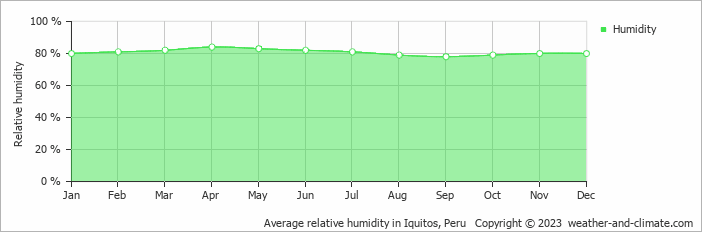
Humidity in Padre Cocha by Month
The city experiences its highest humidity in April, reaching 84%. In September, the humidity drops to its lowest level at 78%. What does this mean? Read our detailed page on humidity levels for further details.
Relative humidity over the year
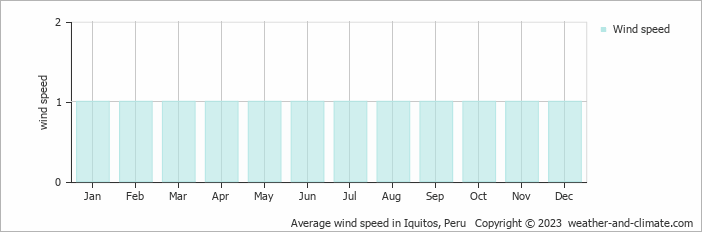
Wind Speed in Padre Cocha
The mean wind speed over the year ranges from 1 m/s (2 knots) in January, February, March, April, May, June, July, August, September, October, November and December to 1 m/s (2 knots) in January, February, March, April, May, June, July, August, September, October, November and December. What does this mean?
The mean monthly wind speed over the year (meters per second)
Padre Cocha 3-Day Forecast
Check the conditions for any month of the year.
Best Time to Visit Padre Cocha
Throughout the year, Padre Cocha receives heavy precipitation with no month falling below 160 mm (6.3 in) of rainfall. This creates a perpetually wet climate with consistent rain patterns. The relatively driest month is August with 160 mm (6.3 in), though this still represents significant rainfall.Visitors should come prepared for wet weather regardless of when they visit, bring a poncho or umbrella. Seeking the perfect travel destination for this year? We've created a tool that suggests locations matching your desired weather. Let our weather planner guide your travel decisions.


