Øby Weather & Climate: Best Time to Visit
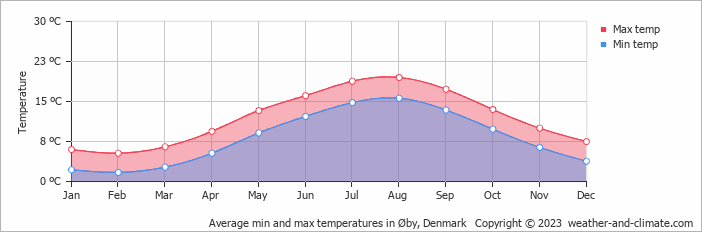
Øby, Midtjylland, Denmark, experiences significant temperature variation throughout the year. Summers bring daytime highs of 20°C (68°F) in August, while winters cool to 5°C (41°F) in February.
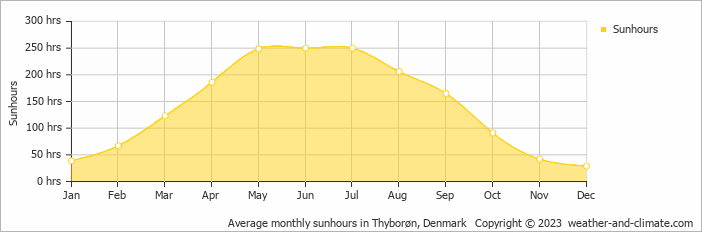
The city receives considerable rain/snowfall, with around 1050 mm (41 in) annually. October is the wettest month. The most sunshine falls in June, with an average of 8.3 hours of daily sunshine.
Monthly Temperature in Øby
Depending on the time of the year, temperatures range from pleasant to chilly in Øby. Typically, average maximum daytime temperatures range from a pleasant 20°C (68°F) in August to a chilly 5°C (41°F) in the coolest month, February.
Nights vary from 16°C (61°F) in August to around 2°C (36°F) during the colder months.
Check out our detailed temperature page for more information.
Temperature ranges by month
Rainfall in Øby
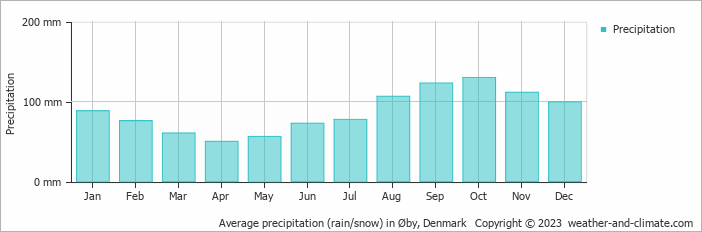
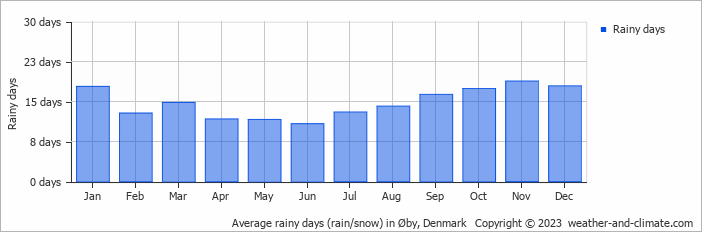
Øby has a relatively rain/snowy climate with high precipitation levels, averaging 1050 mm (41 in) of rain/snowfall annually. The climate in Øby shows significant variation throughout the year. Expect high rainfall in October, the wettest month, with an average of 130 mm (5.1 in) of precipitation over 17 rainy days.
In contrast, the driest month April offers drier and sunnier days, with around 50 mm (2 in) of rainfall over 12 rainy days. For more details, please visit our Øby Precipitation page.
The mean monthly precipitation over the year, including rain, hail, and snow
The average number of days each month with precipitation
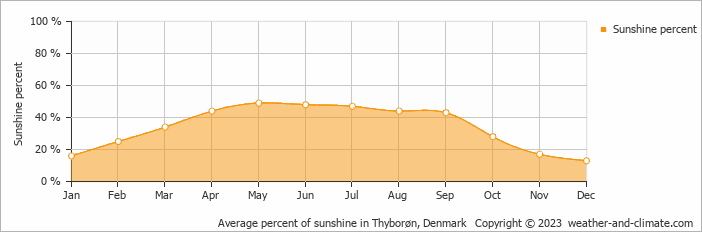
Sunshine Hours in Øby
For those who appreciate different seasons, Øby serves as an ideal destination. Expect longer, more sun-filled days in June with an average of 8.3 hours of sunshine daily, and embrace the darker days in December, offering only 1.0 hours of daily sunlight.
Visit our detailed sunshine hours page for more information.
Monthly hours of sunshine
Daily hours of sunshine
Daily percentage of sunshine
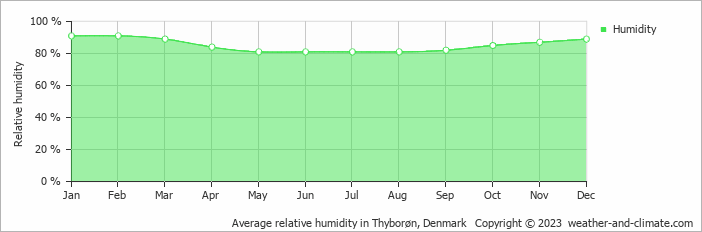
Humidity in Øby by Month
The city experiences its highest humidity in January, reaching 91%. In May, the humidity drops to its lowest level at 81%. What does this mean? Read our detailed page on humidity levels for further details.
Relative humidity over the year
Øby 3-Day Forecast
Check the conditions for any month of the year.
Best Time to Visit Øby
During the months of June, July, August and September, Øby enjoys pleasant weather with average temperatures ranging from 16°C (61°F) to 20°C (67°F). These months are perfect for sightseeing and exploring.Rainfall during this time ranges from 73 mm (2.9 in) in June to 123 mm (4.8 in) in September. This means you can expect a mix of sunny days and occasional showers. Planning your next adventure but unsure where to go? Our climate tool suggests perfect locations tailored to your preferred weather conditions. Discover your ideal travel destination with our weather planner.


