Nørre Lyngvig Weather & Climate: Best Time to Visit
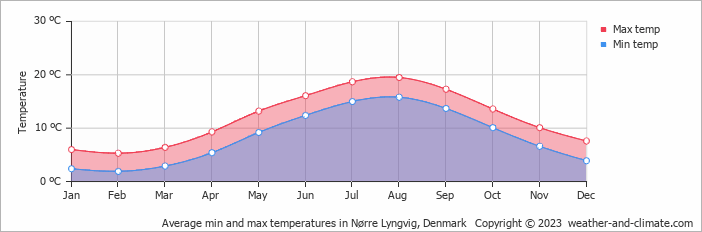
Temperatures in Nørre Lyngvig, Midtjylland, Denmark, vary greatly throughout the year. August is the hottest month at 20°C (68°F), while February is the coldest at 5°C (41°F).
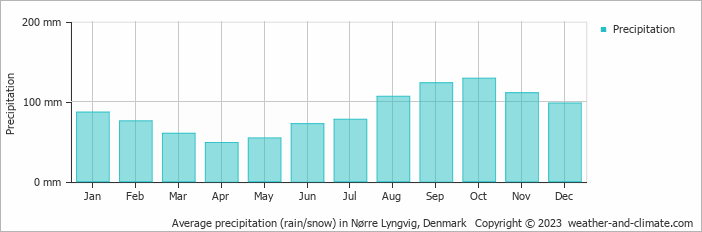
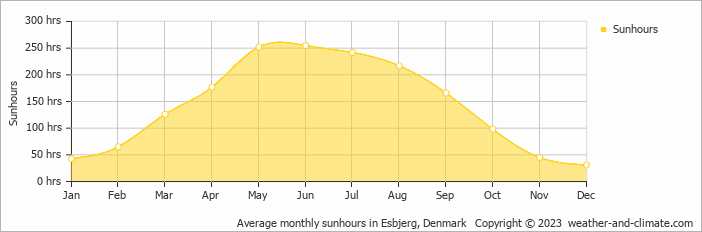
With around 1042 mm (41 in) of annual rain/snowfall, Nørre Lyngvig has a notably wet climate. The wettest month is October. The sunniest month is June, with 8.5 hours of sunshine per day on average.
Monthly Temperature in Nørre Lyngvig
The climate in Nørre Lyngvig is known for significant temperature differences throughout the year, making the weather dynamic. Average daytime temperatures reach a pleasant 20°C (68°F) in August. In February, the coolest month of the year, temperatures drop to a chilly 5°C (41°F).
At night, temperatures range from around 16°C (61°F) in August to 2°C (36°F) in February.
Check out our detailed temperature page for more information.
Temperature ranges by month
Rainfall in Nørre Lyngvig
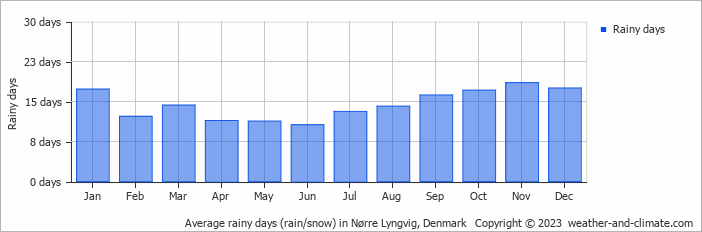
Nørre Lyngvig has a notably wet climate with abundant precipitation, recording 1042 mm (41 in) of rain/snowfall per year. Nørre Lyngvig can be quite wet during October, receiving approximately 129 mm (5.1 in) of precipitation over 17 rainy days.
In contrast, during the driest month (April), you will experience much drier conditions, with 49 mm (1.9 in) of precipitation spread across 11 rainy days days. For more details, please visit our Nørre Lyngvig Precipitation page.
The mean monthly precipitation over the year, including rain, hail, and snow
The average number of days each month with precipitation
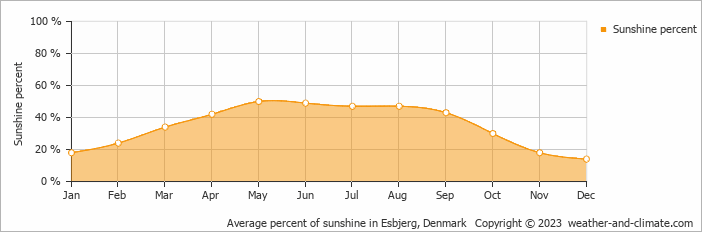
Sunshine Hours in Nørre Lyngvig
Nørre Lyngvig can be enjoyed more throughout the sunniest month of June under a blue sky, with approximately 8.5 hours of sunshine daily. In contrast, the city experiences much darker days in December, with only 1.0 hours of sunlight per day.
Visit our detailed sunshine hours page for more information.
Monthly hours of sunshine
Daily hours of sunshine
Daily percentage of sunshine
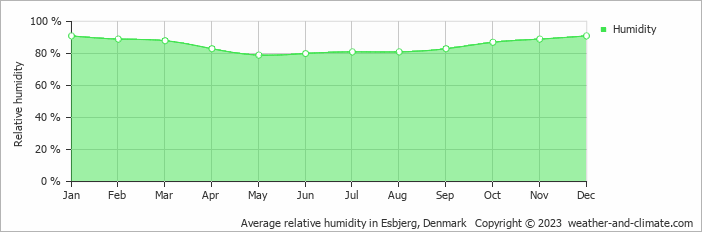
Humidity in Nørre Lyngvig by Month
The city experiences its highest humidity in January, reaching 91%. In May, the humidity drops to its lowest level at 79%. What does this mean? Read our detailed page on humidity levels for further details.
Relative humidity over the year
Nørre Lyngvig 3-Day Forecast
Check the conditions for any month of the year.


