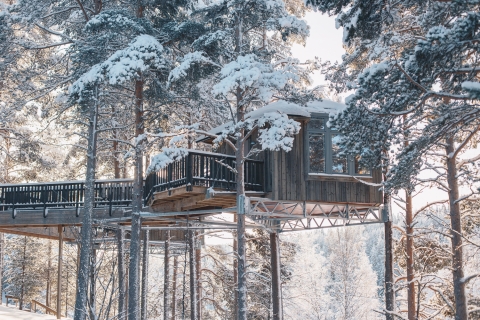
NornûÊs Weather and Climate: A Comprehensive Guide
NornûÊs experiences great temperature shifts.
The city's weather can transition from pleasant days
to very cold weather.
It receives a reasonable amount of rain/snowfall.
Letãs explore the climate details in depth to provide you with a complete overview.
Average maximum day and minimum night temperature
The climate in NornûÊs is known for significant temperature differences throughout the year, making the weather dynamic. Average daytime temperatures reach a pleasant 20ô¯C in July. In February, the coolest month of the year, temperatures drop to a very cold -3ô¯C.
At night, you can expect cooler temperatures, with averages dropping to around -10ô¯C during this month. Check out our detailed temperature page for more information.Temperature ranges by month

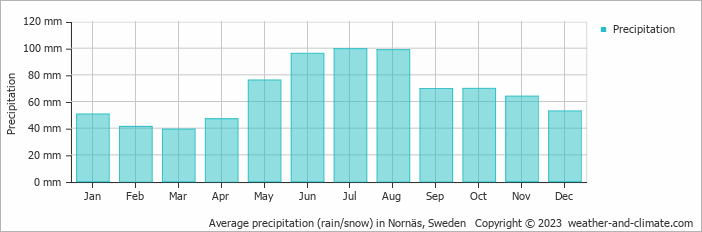
Precipitation and rainy days
Generally, NornûÊs receives mid-range precipitation levels, with 804 mm annually. NornûÊs can be quite wet during July, receiving approximately 100 mm of precipitation over 17 rainy days. In contrast March, experiences much drier conditions, with 39 mm of snowfall, spread across 14 snowy days. For more details, please visit our NornûÊs Precipitation page.The mean monthly precipitation over the year, including rain, hail and snow
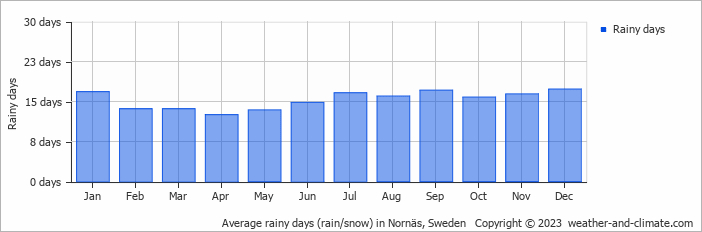
The average number of days each month with precipitation
almost clear and no rain broken clouds and chance of slight snow broken clouds and no rainForecast for NornûÊs
 1 m/s
1 m/s![]() 6 m/s
6 m/s![]() 4 m/s
4 m/s![]()
Select a Month of Interest
Check the conditions for any month of the year.
The best time of year to visit NornûÊs in Sweden
Other facts from our historical weather data:July has an average maximum temperature of 20ô¯C and is the warmest month of the year.
The coldest month is February with an average maximum temperature of -3ô¯C.
July tops the wettest month list with 100 mm of rainfall.
March is the driest month with 39 mm of precipitation.
No idea where to travel to this year? We have a tool that recommends destinations based on your ideal conditions. Find out where to go with our weather planner.