Mosevrå Weather & Climate: Best Time to Visit
Average temperatures, rainfall, sunshine and the best time to visit Mosevrå.
Climate overview of Mosevrå
Temperatures in Mosevrå, Syddanmark, Denmark, vary greatly throughout the year. August is the hottest month at 20°C (68°F), while February is the coldest at 5°C (41°F).
Rain/snowfall is high, totalling around 1016 mm (40 in) per year. October is the wettest month and April the driest. The most sunshine falls in June, with an average of 8.5 hours of daily sunshine.
Mosevrå Weather by Month
Pick a month to see the average temperature, rainfall and sunshine in Mosevrå — and find the best time to visit.
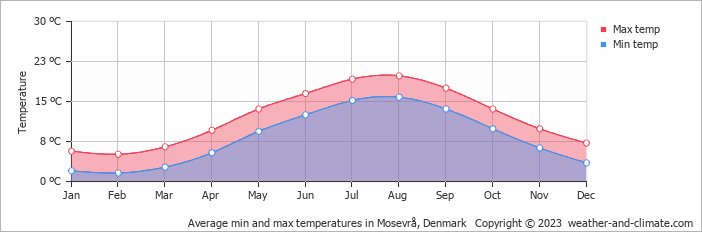
Monthly Temperature in Mosevrå
The climate in Mosevrå is known for significant temperature differences throughout the year, making the weather dynamic. Average maximum daytime temperatures range from a pleasant 20°C (68°F) in August, the warmest time of the year, to a chilly 5°C (41°F) during cooler months like February.
At night, you can expect temperatures ranging from 16°C (61°F) in August to around 2°C (36°F) during February.
Check out our detailed temperature page for more information.
Temperature ranges by month
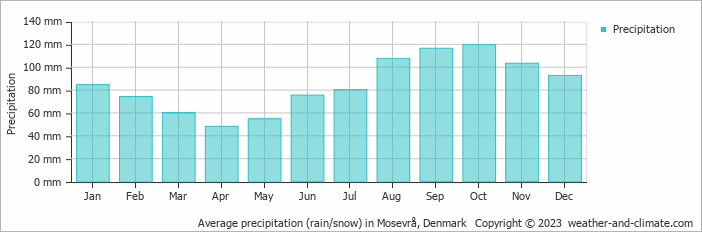
Rainfall in Mosevrå
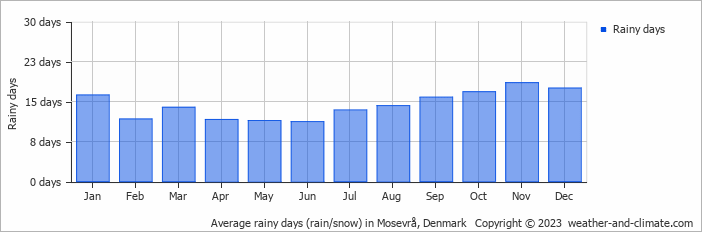
Mosevrå has a notably wet climate with abundant precipitation, recording 1016 mm (40 in) of rain/snowfall per year. Significant seasonal changes in precipitation occur throughout the year. In the wettest month, October it receives high rainfall, averaging 120 mm (4.7 in) of precipitation, recorded across 17 rainy days. In contrast, the driest month April brings less rainfall, with 48 mm (1.9 in) over 12 rainy days. For more details, please visit our Mosevrå Precipitation page.
The mean monthly precipitation over the year, including rain, hail, and snow
The average number of days each month with precipitation
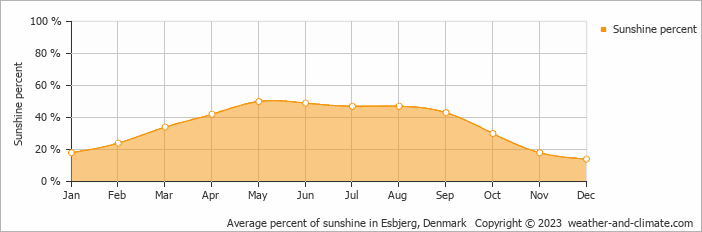
Sunshine Hours in Mosevrå
Seasonal changes in sunshine hours are quite dramatic in Mosevrå. While June receives considerable daily sunshine with up to 8.5 hours, December marks the darkest time of the year, where sunshine is scarce with only 1.0 hours of sunlight per day.
Visit our detailed sunshine hours page for more information.
Monthly hours of sunshine
Daily hours of sunshine
Daily percentage of sunshine
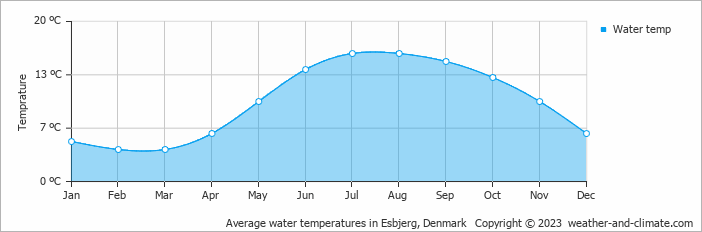
Water Temperature in Mosevrå
The mean water temperature over the year ranges from 4°C (39°F) in February to 16°C (61°F) in July.
Water temperature over the year
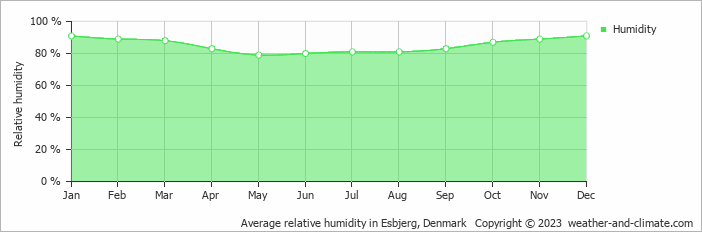
Humidity in Mosevrå by Month
The city experiences its highest humidity in January, reaching 91%. In May, the humidity drops to its lowest level at 79%. What does this mean? Read our detailed page on humidity levels for further details.
Relative humidity over the year
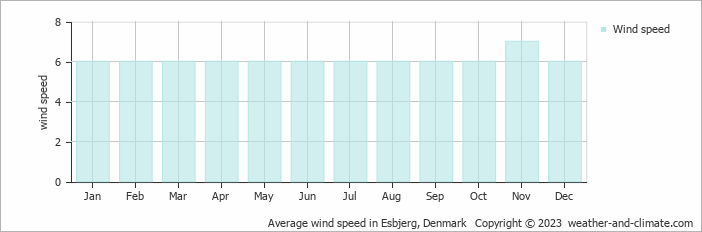
Wind Speed in Mosevrå
The mean wind speed varies between 6 m/s (12 knots) and 7 m/s (14 knots) throughout the year. It is lowest in January, February, March, April, May, June, July, August, September, October and December and highest during November. What does this mean?
The mean monthly wind speed over the year (meters per second)
Best Time to Visit Mosevrå
Frequently asked questions about the climate in Mosevrå
What is the best time to visit Mosevrå?
July and August typically offer the most optimal weather in Mosevrå. In contrast, January, February, March, April, November and December tend to have less optimal conditions.
What temperatures can I expect in Mosevrå?
Daytime highs range from 5°C (41°F) in February to 20°C (68°F) in August. Nighttime lows range from 2°C (36°F) to 16°C (61°F). Temperatures vary considerably through the year.
How much rain does Mosevrå get?
Annual rainfall is around 1016 mm (40 in). October is the wettest month with 120 mm (4.7 in), while April is the driest with 48 mm (1.9 in).
How sunny is Mosevrå?
Mosevrå receives around 1,717 hours of sunshine per year. June is the sunniest month with 255 hours, while December is the cloudiest with just 31 hours.
Mosevrå 3-Day Forecast
Mosevrå 3-Day Forecast
Mosevrå on the map
Mosevrå is highlighted — select any city to see its climate.
Popular this month
Where to go in July — average daytime high across popular destinations.