Lynton Weather and Climate: A Comprehensive Guide
The weather in Lynton sees moderate temperature fluctuations over the course of a year.
Temperatures can be pleasant at the high end
to roughly cold at the low end.
It is also known for its large amounts of rainfall.
Now, let’s explore all the climate details to give you a full picture.
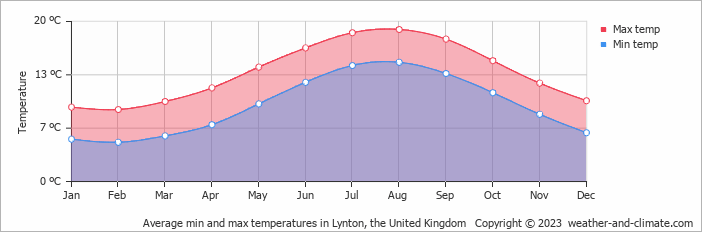
Average maximum day and minimum night temperature
The weather in Lynton changes moderately throughout the year, offering enough variation to appreciate each season. Typically, average maximum daytime temperatures range from a pleasant 19°C in August to a chilly 9°C in the coolest month, February.
Nights are cooler, with lows often dropping to around 5°C during the colder months.Check out our detailed temperature page for more information.
Temperature ranges by month
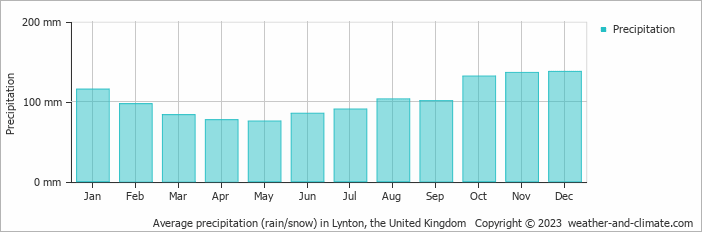
Precipitation and rainy days
Lynton experiences significant rainfall throughout the year, averaging 1233 mm of precipitation annually. Lynton offers a pleasant mix of wetter and slightly drier months. The difference in precipitation between December (137 mm) and May (75 mm) is not too significant, making the climate enjoyable for visitors and residents alike.
The mean monthly precipitation over the year, including rain, hail and snow
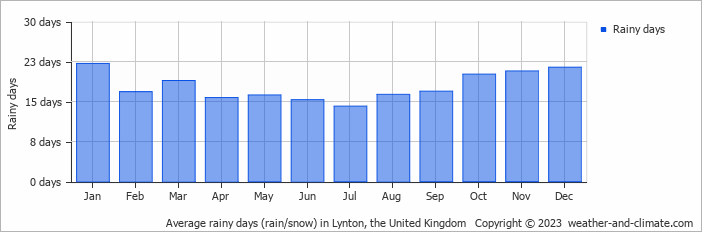
The average number of days each month with precipitation
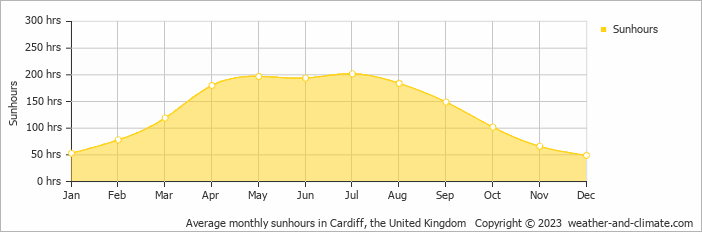
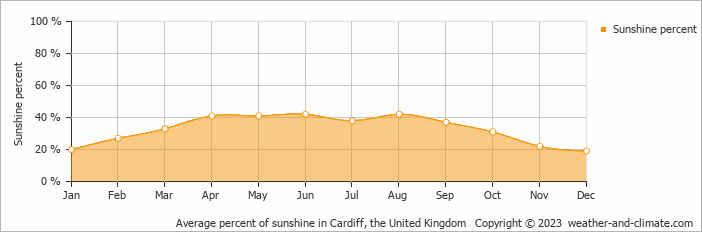
Sunshine over the year
For those who appreciate different seasons, Lynton serves as an ideal destination. Expect longer, more sun-filled days in July with an average of 6.7 hours of sunshine daily, and embrace the darker days in December, offering only 1.6 hours of daily sunlight.
Visit our detailed sunshine hours page for more information.
Monthly hours of sunshine
Daily hours of sunshine
Daily percentage of sunshine
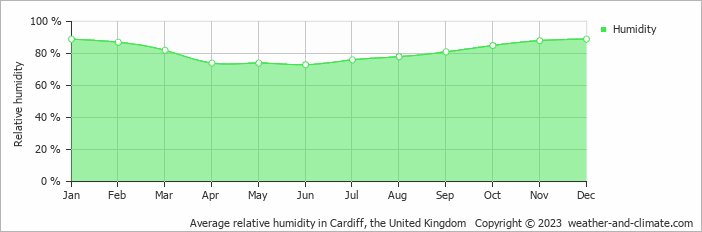
Average humidity
The city experiences its highest humidity in January, reaching 89%. In June, the humidity drops to its lowest level at 73%. What does this mean? Read our detailed page on humidity levels for further details.
Relative humidity over the year
Forecast for Lynton


Select a Month of Interest
Check the conditions for any month of the year.
The best time of year to visit Lynton in the United Kingdom
Other facts from our historical weather data:August has an average maximum temperature of 19°C and is the warmest month of the year.
The coldest month is February with an average maximum temperature of 9°C.
December tops the wettest month list with 137 mm of rainfall.
May is the driest month with 75 mm of precipitation.
July is the sunniest month with an average of 202 hours of sunshine.
No idea where to travel to this year? We have a tool that recommends destinations based on your ideal conditions. Find out where to go with our weather planner.


