Khāpri Weather & Climate: Best Time to Visit
Average temperatures, rainfall, sunshine and the best time to visit Khāpri.
Climate overview of Khāpri
The climate in Khāpri, Maharashtra, India, is marked by large temperature swings across the seasons, ranging from 44°C (111°F) in May to 29°C (84°F) in December.
The city receives considerable rainfall, with around 1252 mm (49 in) annually. July is the wettest month. It has distinct dry (November to May) and wet (June to September) seasons. The sunniest month is May, with 9.8 hours of sunshine per day on average.
Khāpri Weather by Month
Pick a month to see the average temperature, rainfall and sunshine in Khāpri — and find the best time to visit.
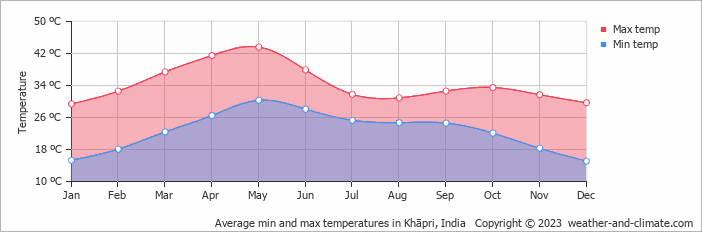
Monthly Temperature in Khāpri
In Khāpri, temperatures differ significantly between summer and winter months. Typically, average maximum daytime temperatures range from a very hot 44°C (111°F) in May to a comfortable 29°C (84°F) in the coolest month, December.
Nights vary from 30°C (86°F) in May to around 15°C (59°F) during the colder months.
Check out our detailed temperature page for more information.
Temperature ranges by month
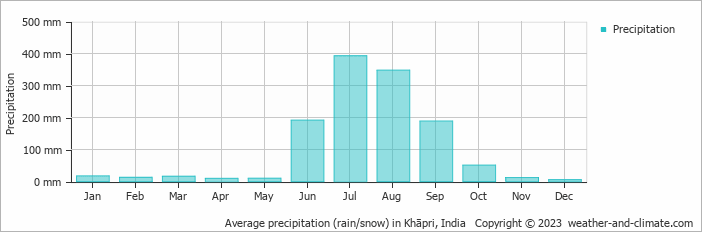
Rainfall in Khāpri
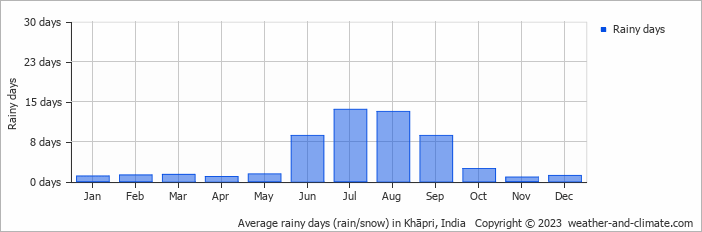
Khāpri experiences significant rainfall throughout the year, averaging 1252 mm (49 in) of precipitation annually. The climate in Khāpri shows significant variation throughout the year. Expect heavy rainfall in July, the wettest month, with an average of 392 mm (15 in) of precipitation over 14 rainy days.
In contrast, the driest month December offers drier and sunnier days, with around 5 mm (0.2 in) of rainfall over a single rainy day. For more details, please visit our Khāpri Precipitation page.
The mean monthly precipitation over the year, including rain, hail, and snow
The average number of days each month with precipitation
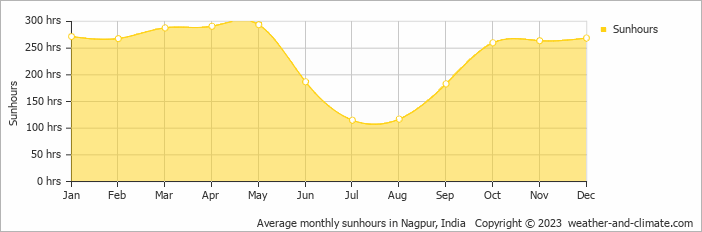
Sunshine Hours in Khāpri
For those who appreciate different seasons, Khāpri serves as an ideal destination. Expect longer, more sun-filled days in May with an average of 9.8 hours of sunshine daily, and embrace the darker days in July, offering only 3.8 hours of daily sunlight.
Visit our detailed sunshine hours page for more information.
Monthly hours of sunshine
Daily hours of sunshine
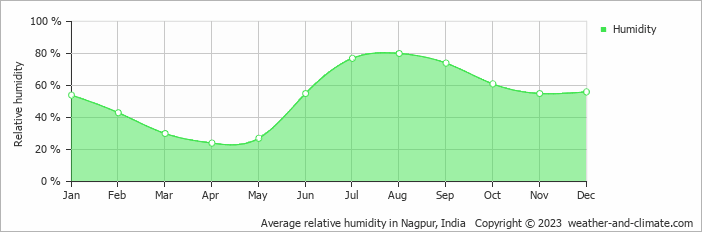
Humidity in Khāpri by Month
The relative humidity is moderate throughout the year in Khāpri.
The city experiences its highest humidity in August, reaching 80%. In April, the humidity drops to its lowest level at 24%. What does this mean? Read our detailed page on humidity levels for further details.
Relative humidity over the year
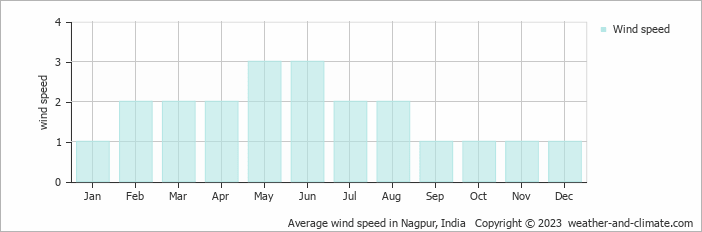
Wind Speed in Khāpri
The mean wind speed varies between 1 m/s (2 knots) and 3 m/s (6 knots) throughout the year. It is lowest in January, September, October, November and December and highest during May and June. What does this mean?
The mean monthly wind speed over the year (meters per second)
Best Time to Visit Khāpri
To make the most of your visit, consider exploring early in the morning or during the pleasant late afternoon hours when the temperature is most comfortable.
Be aware that June, July, August and September constitute the rainy season, with significant precipitation. Wondering where to travel based on your weather preferences? Our recommendation tool helps you find destinations with your ideal climate conditions. Use our weather planner to find your perfect destination.
Frequently asked questions about the climate in Khāpri
What is the best time to visit Khāpri?
January typically offers the most optimal weather in Khāpri. In contrast, March, April, May, June, July, August, September and October tend to have less optimal conditions. Khāpri has distinct dry (November to May) and wet (June to September) seasons.
What temperatures can I expect in Khāpri?
Daytime highs range from 29°C (84°F) in December to 44°C (111°F) in May. Nighttime lows range from 15°C (59°F) to 30°C (86°F). Temperatures vary considerably through the year.
How much rain does Khāpri get?
Annual rainfall is around 1252 mm (49 in). July is the wettest month with 392 mm (15 in), while December is the driest with 5 mm (0.2 in).
How sunny is Khāpri?
Khāpri receives around 2,808 hours of sunshine per year. May is the sunniest month with 294 hours, while July is the cloudiest with just 115 hours. Overall, Khāpri enjoys abundant sunshine.
Khāpri 3-Day Forecast
Khāpri 3-Day Forecast
Khāpri on the map
Khāpri is highlighted — select any city to see its climate.
Popular this month
Where to go in July — average daytime high across popular destinations.
Bucket list
Need travel inspiration? Check out our bucket list articles and be inspired.
 A paradise called Andaman Islands
Though officially Indian, the Andamans are nearer Myanmar, Indonesia, and Thailand, resulting in amazing, budget-friendly white-sand beaches.
The 5 most beautiful monasteries in Ladakh
Explore Ladakh's spiritual essence through its incredible Buddhist monasteries. See architectural wonders, rich traditions, and serene landscapes in this guide.
Sleeping under the stars and riding camels in Rajasthan
A desert safari in Jaisalmer is definitely one of the highlights during a visit to India. Spending a night in the desert is a great adventurous bucket list experience.
Avoid mass tourism on an eco boat in the backwaters of Kerala
We can tell you now how you can avoid being surrounded by tourists and at the same time minimize your impact on the environment.