Kāshīpur Climate by Month
Kāshīpur experiences great temperature shifts.
The city's weather can transition from very hot days
to pleasant weather.
It receives mid-range precipitation levels.
Let's now guide you through the climate details for a complete overview.
Average day and night temperature
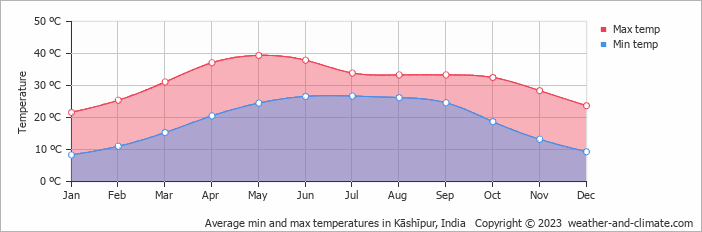
The climate in Kāshīpur is known for significant temperature differences throughout the year, making the weather dynamic. Average daytime temperatures range from a very hot 39°C in May, the warmest time of the year, to a pleasant 22°C during cooler months like January. At night, temperatures typically average around 8°C during these months.
The mean minimum and maximum temperatures throughout the year
Precipitation and rainy days
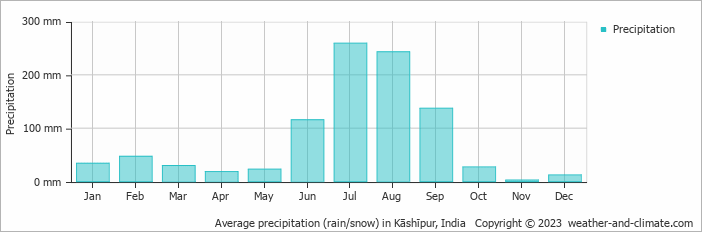
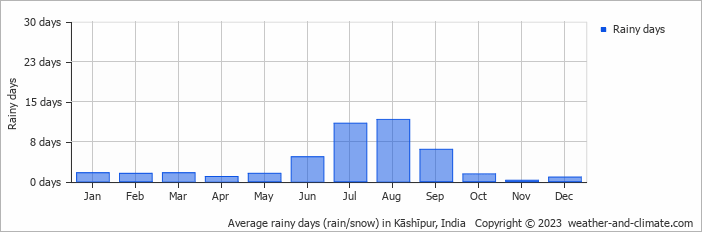
Generally, Kāshīpur receives mid-range precipitation levels, with 948 mm annually. Significant seasonal changes in precipitation occur throughout the year. During the wetter season, July receives heavy rainfall, averaging 259 mm of precipitation, recorded across 11 rainy days. In contrast, the drier season, November brings less rainfall, with 2.5 mm over 0 rainy days.The mean monthly precipitation over the year, including rain, hail and snow
The average number of days each month with precipitation
The best time of year to visit Kāshīpur in India
During the months of January, February and December you are most likely to experience good weather with pleasant average temperatures that fall between 20°C and 26°C.Other facts from our historical weather data:
Most rainfall (rainy season) is seen in July and August.
Yes, the months of April, November and December are very dry.
May has an average maximum temperature of 39°C and is the warmest month of the year.
The coldest month is January with an average maximum temperature of 22°C.
July tops the wettest month list with 259 mm of rainfall.
November is the driest month with 3 mm of precipitation.
No idea where to travel to this year? We have a tool that recommends destinations based on your ideal conditions. Find out where to go with our weather planner.


