Guntūr Weather & Climate: Best Time to Visit
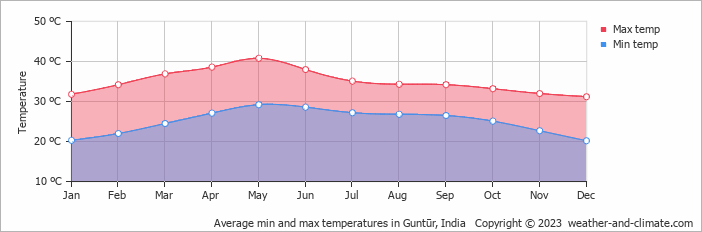
Temperatures in Guntūr, India, shift moderately through the seasons. The warmest month is May at 41°C (106°F), and the coolest is December at 31°C (88°F).
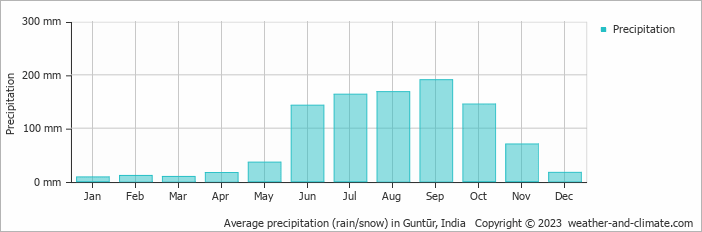
With around 978 mm (39 in) of annual rainfall, the city has moderate precipitation levels. September is the wettest month and January the driest. It also has a distinct dry season from December to May.
Monthly Temperature in Guntūr
The climate in Guntūr experiences moderate temperature changes, with mild shifts between seasons. Typically, average maximum daytime temperatures range from a very hot 41°C (106°F) in May to a very warm 31°C (88°F) in the coolest month, December.
Nights vary from 29°C (84°F) in May to around 20°C (68°F) during the colder months.
Check out our detailed temperature page for more information.
Temperature ranges by month
Rainfall in Guntūr
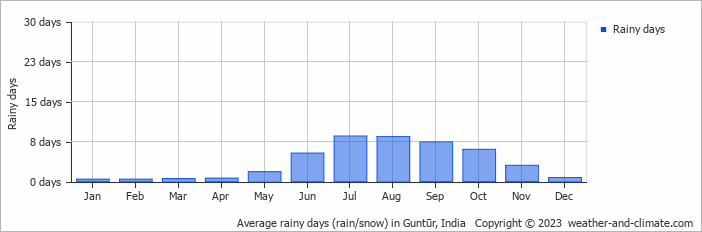
Generally, Guntūr receives mid-range precipitation levels, with 978 mm (39 in) annually. The climate in Guntūr shows significant variation throughout the year. Expect heavy rainfall in September, the wettest month, with an average of 191 mm (7.5 in) of precipitation over 7 rainy days.
In contrast, the driest month January offers drier and sunnier days, with around 8.3 mm (0.3 in) of rainfall over 0 rainy days. For more details, please visit our Guntūr Precipitation page.
The mean monthly precipitation over the year, including rain, hail, and snow
The average number of days each month with precipitation
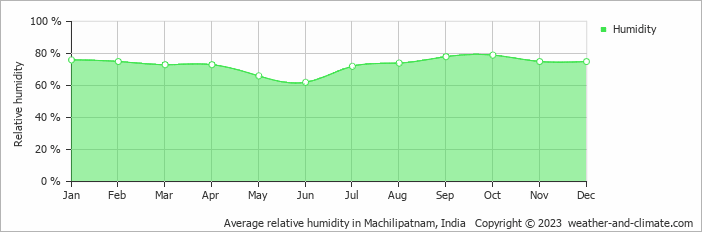
Humidity in Guntūr by Month
The relative humidity is high throughout the year in Guntūr.
The city experiences its highest humidity in October, reaching 79%. In June, the humidity drops to its lowest level at 62%. What does this mean? Read our detailed page on humidity levels for further details.
Relative humidity over the year
Guntūr 3-Day Forecast
Check the conditions for any month of the year.
Best Time to Visit Guntūr
With its warm weather, Guntūr experiences temperatures from 31°C (88°F) to 41°C (106°F) throughout the year. January, February, March, April, May and December offers the driest weather, which makes it a good time to visit.It's smart to plan your activities during the cooler morning hours or take advantage of the refreshing evenings.
Note that July, August and September make up the rainy season, with heavier precipitation expected. Wondering where to travel based on your weather preferences? Our recommendation tool helps you find destinations with your ideal climate conditions. Use our weather planner to find your perfect destination.


