Monthly Average Rainy days in Guntūr
The number of days each month with rain, snow and hail in Guntūr (), India.
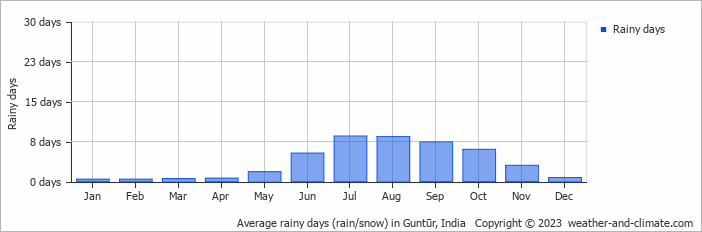
- Guntūr has dry periods in January, February, March, April, May and December.
- On average, July is the most rainy with 8 days of rain/snow.
- On average, January is the driest month with 0 rainy days.
- The average annual number of rainy days is 43.
Current rainfall in Guntūr
Tue Jan 07
31°C | 19°C
SE  4 m/s
4 m/s
4 m/salmost clear and no rain
Wed Jan 08
32°C | 19°C
S 3 m/s
3 m/salmost clear and no rain
Thu Jan 09
30°C | 20°C
E 3 m/s
3 m/salmost clear and no rain


