Baie du Tombeau Weather and Climate: A Comprehensive Guide
Baie du Tombeau has pretty similar weather over the course of the year.
It receives mid-range precipitation levels.
Now, let’s break down all the climate details for a clearer picture.
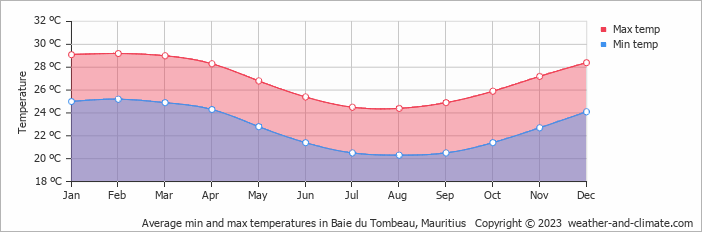
Average maximum day and minimum night temperature
With minimal seasonal shifts, Baie du Tombeau experiences a constant climate year-round. Average maximum daytime temperatures range from a comfortable 29°C in February, the warmest time of the year, to a comfortable 24°C during cooler months like August.
At night, temperatures typically drop to an average of around 20°C during these months.Check out our detailed temperature page for more information.
Temperature ranges by month
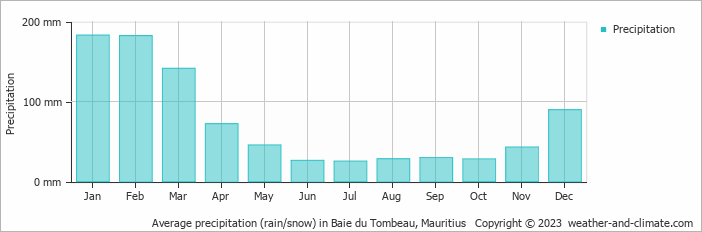
Precipitation and rainy days
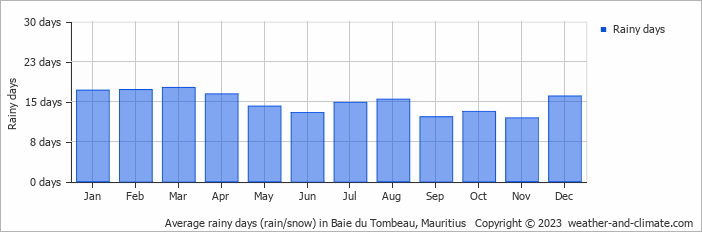
Generally, Baie du Tombeau receives mid-range precipitation levels, with 894 mm annually. Significant seasonal changes in precipitation occur throughout the year. During the wetter season, January receives heavy rainfall, averaging 183 mm of precipitation, recorded across 17 rainy days. In contrast, the drier season, July brings less rainfall, with 25 mm over 15 rainy days. For more details, please visit our Baie du Tombeau Precipitation page.
The mean monthly precipitation over the year, including rain, hail and snow
The average number of days each month with precipitation
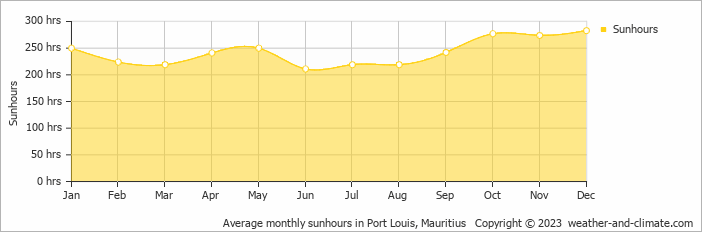
Sunshine over the year
While the amount of sunshine in Baie du Tombeau varies throughout the year, all seasons offer their own charm. Enjoy up to 9.4 hours of daily sun in December, and experience slightly darker atmosphere in June, with about 7.0 hours of daily sunlight.
Visit our detailed sunshine hours page for more information.
Monthly hours of sunshine
Daily hours of sunshine
broken clouds and chance of rain broken clouds and rain broken clouds and thunderForecast for Baie du Tombeau
 3 m/s
3 m/s![]() 4 m/s
4 m/s![]() 4 m/s
4 m/s![]()
Select a Month of Interest
Check the conditions for any month of the year.
The best time of year to visit Baie du Tombeau in Mauritius
During the months of June, July, August, September and October you are most likely to experience good weather with pleasant average temperatures that fall between 20°C and 26°C.Other facts from our historical weather data:
Most rainfall (rainy season) is seen in January and February.
February has an average maximum temperature of 29°C and is the warmest month of the year.
The coldest month is August with an average maximum temperature of 24°C.
January tops the wettest month list with 183 mm of rainfall.
July is the driest month with 25 mm of precipitation.
December is the sunniest month with an average of 283 hours of sunshine.
No idea where to travel to this year? We have a tool that recommends destinations based on your ideal conditions. Find out where to go with our weather planner.


