Climate ▸Forecast ▸January ▸February ▸
JanuaryFebruaryMarchAprilMayJuneJulyAugustSeptemberOctoberNovemberDecember

Baie du Tombeau Rainfall & Precipitation: Monthly Averages and Year-Round Insights

This page shows the average amount of rainfall per month in Baie du Tombeau. The numbers are calculated over a 30-year period to provide a reliable average.
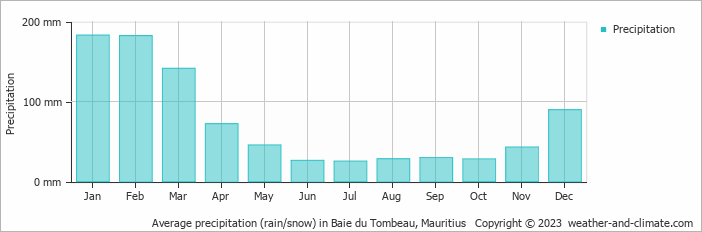
 Let's now guide you through the details for a complete overview.

Generally, Baie du Tombeau receives mid-range precipitation levels, with 894 mm annually.

Monthly Precipitation Levels

The average number of days each month with precipitation (> 0.2 mm)

The climate in Baie du Tombeau shows significant variation throughout the year. Expect 183 mm of precipitation during the wettest month January, distributed over 17 rainy days.

In contrast, July offers drier and sunnier days, with around 25 mm of rainfall over 15 rainy days.

January, the wettest month, has a maximum daytime temperature of 29°C. The city receives 250 hours of sunshine in this period. During the driest month July you can expect a temperature of 25°C. For more detailed insights into the city’s temperatures, visit our Baie du Tombeau Temperature page.

Annual Precipitation in Mauritius

The map below shows the annual precipitation across Mauritius. You can also select the different months in case you are interested in a specific month.

Annual
Map not visible? Whoops sorry! Please refresh the page.
Legend heavy rainfall high moderate low almost none
Heavy annual rainfall has been defined as more than 1000 mm precipitation. High: 600 mm to 1000 mm. Moderate: 250 mm to 600 mm. Low: less than 250 mm.

Amsterdam Precipitation Compared World Wide

Baie du Tombeau’s average annual precipitation is 894 mm. Let’s compare this to some popular worldwide tourist destinations:

The city of Rome, Italy, has an average annual precipitation of 832 mm, spread fairly evenly throughout the year.

In Shanghai, China, the annual average precipitation is 1347 mm, with a humid subtropical climate.

Adelaide, Australia, enjoys 511 mm of annual precipitation, with dry summers and wet winters.

Kuala Lumpur, Malaysia, receives 2529 mm of annual rainfall, characteristic of its equatorial tropical rainforest climate, with consistent rainfall throughout the year and peak months during March and November.

How is Precipitation Measured?

Precipitation amounts are measured using specific gauges installed at weather stations, collecting both rain and snow and any other type of precipitation. Rainfall is measured directly in millimeters, while that from snow and ice is obtained by melting it. Automated systems often incorporate heaters to make this easier.

Information from these stations is transmitted via Wi-Fi, satellite, GPS, or telephone connections to central monitoring networks. This information is immediately updated and integrated into weather models and forecasts.

Interesting weather facts

  • "Ginger" was the longest-lasting Atlantic tropical storm, which spun around the open ocean for 28 days in 1971.
  • The world's largest snowflake was recorded in the Guinness Book of Records, at 38 cm wide and 20 cm thick. The snowflake fell at Fort Keogh, Montana, USA, on 28 January 1887.
  • The greatest snowfall recorded was on Mt. Rainier, Washington State, USA—over 31.5 meters fell during the winter of 1972.

For more detailed information about Baie du Tombeau’s weather, including sunshine hours, humidity levels, and temperature data, visit our Baie du Tombeau Climate page.


Current rainfall in Baie du Tombeau

Wed   Jan 22
32°C | 23°C
E 3 m/s
3.3 mm
partly cloudy and  chance of rain

partly cloudy and chance of rain

Thu   Jan 23
32°C | 23°C
E 3 m/s
3.4 mm
partly cloudy and rain

partly cloudy and rain

Fri   Jan 24
31°C | 23°C
NE 3 m/s
2.5 mm
broken clouds and  chance of rain

broken clouds and chance of rain

Interested in more climate information?

This site provides you with all the information you need about the climate in Baie du Tombeau.

Our site offers climate and forecast data for every country in the world. Are you going to Mauritius? On this website you can find historical weather averages for many cities in Mauritius. Not sure yet where to go? We now have a tool which recommends destinations that suit your ideal travel conditions. Find out where to go with our weather planner.