Thyborøn Weather & Climate: Best Time to Visit
The climate in Thyborøn, Midtjylland, Denmark, is marked by large temperature swings across the seasons, ranging from 20°C (68°F) in August to 5°C (41°F) in February.
The city receives around 954 mm (38 in) of rain/snowfall per year. October is the wettest month and April the driest. Sunshine peaks in June, when the city sees around 8.3 hours of sunshine per day.
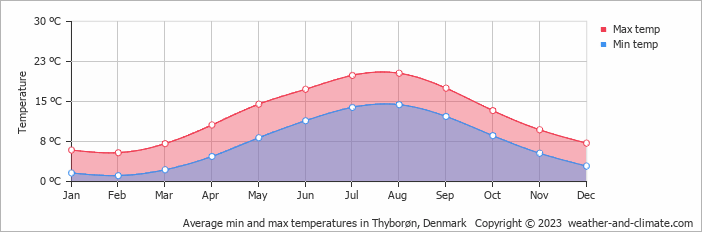
Monthly Temperature in Thyborøn
In Thyborøn, temperatures differ significantly between summer and winter months. On average, daytime temperatures range from a pleasant 20°C (68°F) in August to a chilly 5°C (41°F) in February.
Nighttime temperatures range from 14°C (57°F) in August to 1°C (34°F) in February.
Check out our detailed temperature page for more information.
Temperature ranges by month
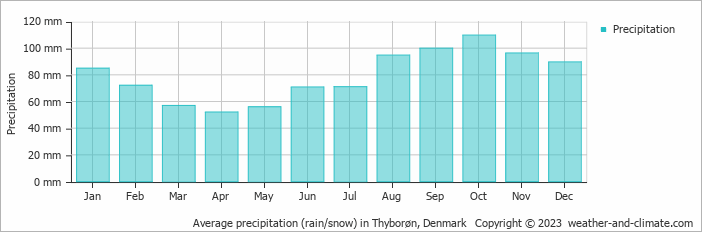
Rainfall in Thyborøn
On average, Thyborøn receives a reasonable amount of rain/snowfall, with an annual precipitation of 954 mm (38 in). The amount of precipitation varies moderately throughout the year. The wettest month, October, sees around 110 mm (4.3 in) of rainfall, perfect for those who enjoy a bit of rain now and then. The driest month, April, still receives a respectable 52 mm (2 in) of rainfall. For more details, please visit our Thyborøn Precipitation page.
The mean monthly precipitation over the year, including rain, hail, and snow
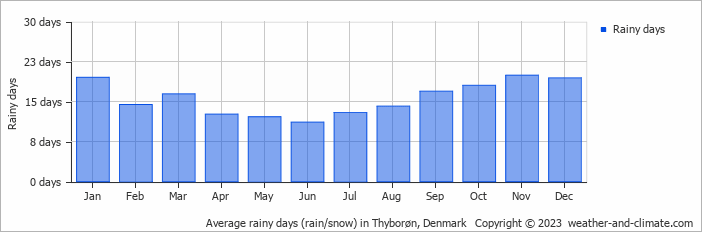
The average number of days each month with precipitation
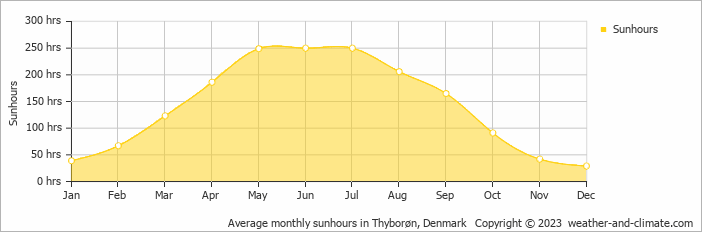
Sunshine Hours in Thyborøn
In Thyborøn, summer days are longer and more sunny, with daily sunshine hours peaking at 8.3 hours in June. As the darker season arrives, the brightness of the sun becomes less. December sees a soft sun for only 1.0 hours per average day.
Visit our detailed sunshine hours page for more information.
Monthly hours of sunshine
Daily hours of sunshine
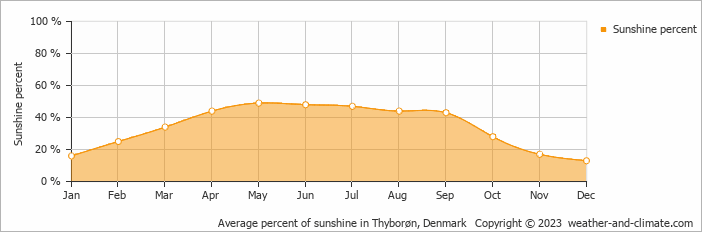
Daily percentage of sunshine
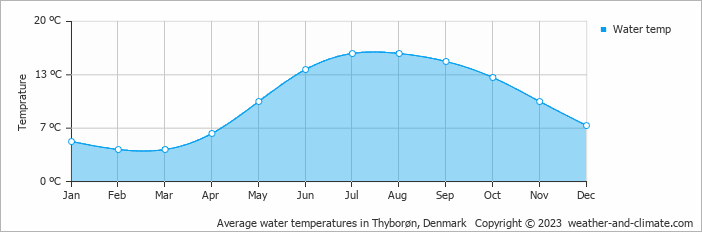
Water Temperature in Thyborøn
The mean water temperature over the year ranges from 4°C (39°F) in February to 16°C (61°F) in July.
Water temperature over the year
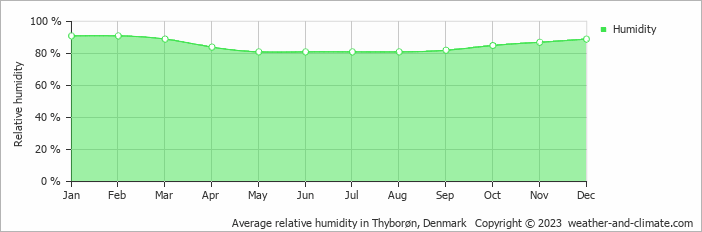
Humidity in Thyborøn by Month
The city experiences its highest humidity in January, reaching 91%. In May, the humidity drops to its lowest level at 81%. What does this mean? Read our detailed page on humidity levels for further details.
Relative humidity over the year
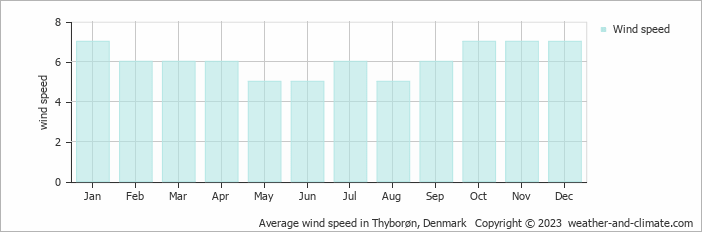
Wind Speed in Thyborøn
The mean wind speed varies between 5 m/s (10 knots) and 7 m/s (14 knots) throughout the year. It is lowest in May, June and August and highest during January, October, November and December. What does this mean?
The mean monthly wind speed over the year (meters per second)
Thyborøn 3-Day Forecast
Check the conditions for any month of the year.


