Mtwara Weather & Climate: Best Time to Visit
Average temperatures, rainfall, sunshine and the best time to visit Mtwara.
Climate overview of Mtwara
The climate in Mtwara, Tanzania, is remarkably consistent, with temperatures year-round averaging 29°C (84°F). The warmest month is March at 30°C (86°F), and the coolest is July at 28°C (82°F).
The city receives around 974 mm (38 in) of rainfall per year. It experiences a distinct dry season from June to October. March is the wettest month and July the driest. Sunshine peaks in October, when the city sees around 10.0 hours of sunshine per day.
Mtwara Weather by Month
Pick a month to see the average temperature, rainfall and sunshine in Mtwara — and find the best time to visit.
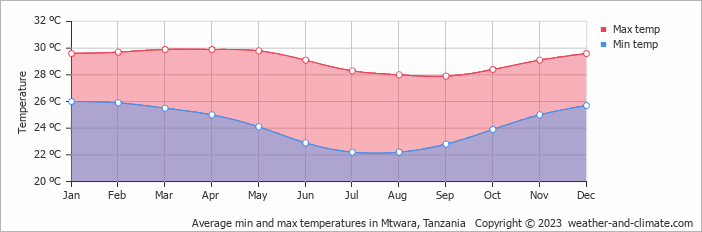
Monthly Temperature in Mtwara
In Mtwara temperatures are generally consistent throughout the year. On average, daytime temperatures range from a comfortable 30°C (86°F) in March to a comfortable 28°C (82°F) in July.
Nighttime temperatures range from 26°C (79°F) in March to 22°C (72°F) in July.
Check out our detailed temperature page for more information.
Temperature ranges by month
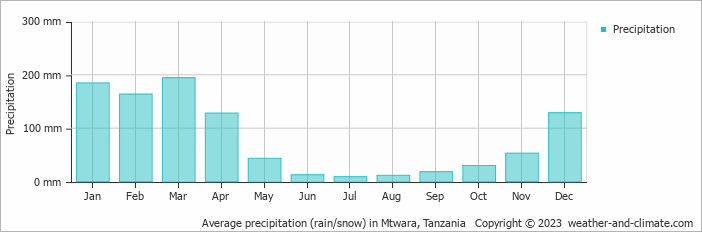
Rainfall in Mtwara
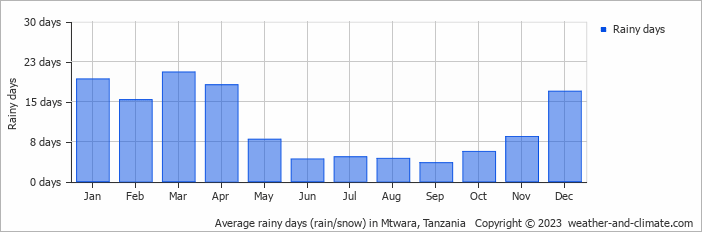
On average, Mtwara receives a reasonable amount of rainfall, with an annual precipitation of 974 mm (38 in). The seasons in Mtwara bring significant changes in precipitation. The wettest month, March, receives heavy rainfall, with an average of 194 mm (7.6 in) of precipitation. This rainfall is distributed across 21 rainy days.
In contrast, the driest month, July, experiences much less rainfall, totaling 8.6 mm (0.3 in) over 5 rainy days. These distinct seasonal differences provide diverse experiences throughout the year. For more details, please visit our Mtwara Precipitation page.
The mean monthly precipitation over the year, including rain, hail, and snow
The average number of days each month with precipitation
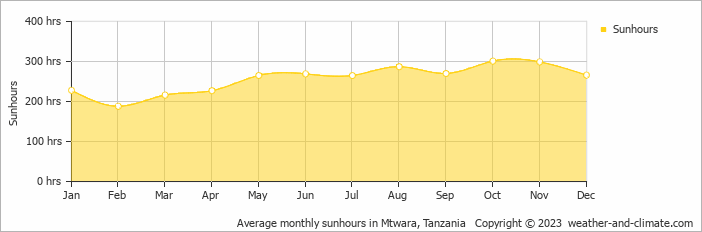
Sunshine Hours in Mtwara
Mtwara enjoys sunny spells year-round. October sees up to 10.0 hours of daily sunshine, perfect for a sunny trip. February, the least sunny month, still offers a generous 6.3 hours of sun despite this cloudier time of the year.
Visit our detailed sunshine hours page for more information.
Monthly hours of sunshine
Daily hours of sunshine
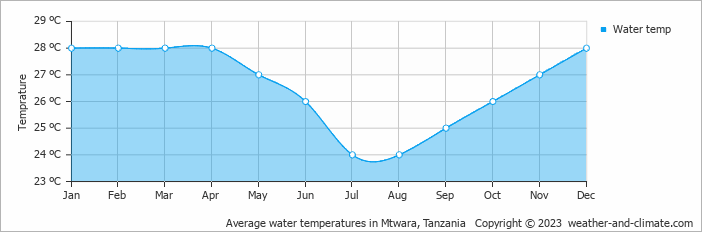
Water Temperature in Mtwara
The mean water temperature over the year ranges from 24°C (75°F) in July to 28°C (82°F) in January.
Water temperature over the year
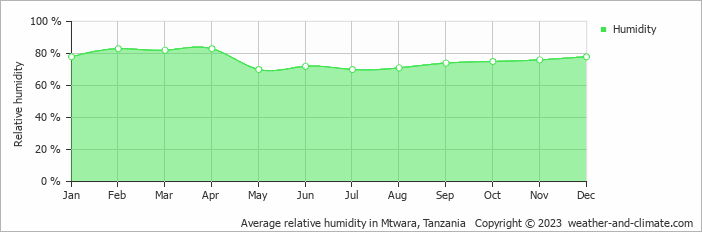
Humidity in Mtwara by Month
The relative humidity is high throughout the year in Mtwara.
The city experiences its highest humidity in February, reaching 83%. In May, the humidity drops to its lowest level at 70%. What does this mean? Read our detailed page on humidity levels for further details.
Relative humidity over the year
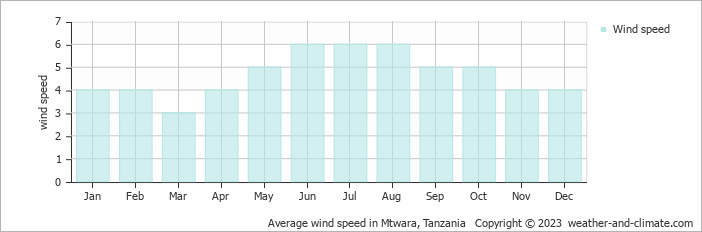
Wind Speed in Mtwara
The average wind speed over the year ranges from 3 m/s (6 knots) to 6 m/s (12 knots). It is lower in March and higher in June, July and August. What does this mean?
The mean monthly wind speed over the year (meters per second)
Best Time to Visit Mtwara
To make the most of your visit, consider exploring early in the morning or during the pleasant late afternoon hours when the temperature is most comfortable.
Be aware that January, February and March constitute the rainy season, with significant precipitation. Looking for inspiration on where to travel this year? We have a tool that recommends destinations based on your ideal conditions. Find out where to go with our weather planner.
Frequently asked questions about the climate in Mtwara
What is the best time to visit Mtwara?
June, July, August, September, October and November typically offer the most optimal weather in Mtwara. In contrast, January and March tend to have less optimal conditions. Mtwara has a distinct dry season from June to October.
What temperatures can I expect in Mtwara?
Daytime highs range from 28°C (82°F) in July to 30°C (86°F) in March. Nighttime lows range from 22°C (72°F) to 26°C (79°F). Temperatures stay relatively stable year-round.
How much rain does Mtwara get?
Annual rainfall is around 974 mm (38 in). March is the wettest month with 194 mm (7.6 in), while July is the driest with 8.6 mm (0.3 in).
How sunny is Mtwara?
Mtwara receives around 3,081 hours of sunshine per year. October is the sunniest month with 301 hours, while February is the cloudiest with just 188 hours. Overall, Mtwara enjoys abundant sunshine.
Mtwara 3-Day Forecast
Mtwara 3-Day Forecast
Mtwara on the map
Mtwara is highlighted — select any city to see its climate.
Popular this month
Where to go in June — average daytime high across popular destinations.
Bucket list
Need travel inspiration? Check out our bucket list articles and be inspired.
 Climb the Kilimanjaro
The Kilimanjaro with its 5895 meters (19340 ft) is the roof of Africa. Climbing Kilimanjaro is a crazy experience and if you like adventure it’s an absolute must for the bucket list.
The Serengeti
The Serengeti has wide, unending grasslands and is known for its spectacular sunsets. The park also offers the biggest wildlife population in the whole of Africa.
Walk Safari In the Selous Game Reserve
We feel the Selous Game Reserve is undoubtedly one of the most beautiful nature reserves in Tanzania and we recommend adding it to your bucket list. Here you can still experience the real Africa.
5 Untouched Safari Destinations in Africa
Discover Africa's hidden national parks, from Zambia's Liuwa Plain to Zimbabwe's Matusadona, offering unique wildlife experiences off the beaten path.