Kwajalein Weather & Climate: Best Time to Visit
With consistently stable weather, Kwajalein, Marshall Islands, sees little seasonal temperature change. Daytime highs average 29°C (84°F), ranging from 29°C (84°F) in June to 29°C (84°F) in February.
The city has a wet climate, receiving around 2601 mm (102 in) of rainfall per year. Despite the high annual total, it has a distinct rainy season from May to December. October is the wettest month.
Monthly Temperature in Kwajalein
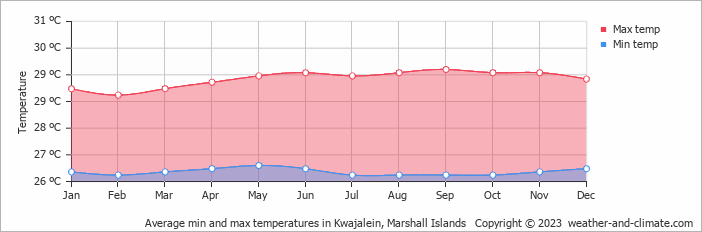
The climate in Kwajalein remains fairly constant, offering comfortable temperatures throughout the year. On average, daytime temperatures range from a comfortable 29°C (84°F) in June to a comfortable 29°C (84°F) in February.
Nighttime temperatures range from 27°C (81°F) in June to 26°C (79°F) in February.
Check out our detailed temperature page for more information.
Temperature ranges by month
Rainfall in Kwajalein
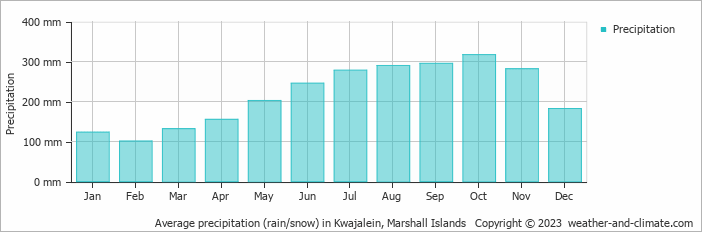
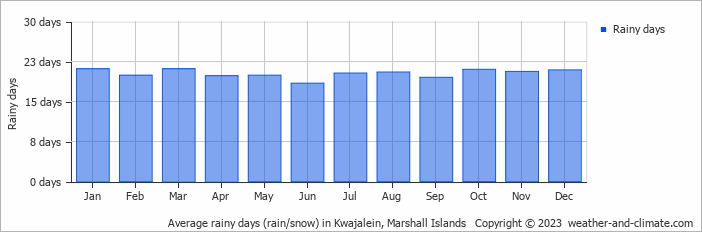
Kwajalein is known for its substantial rainfall, with annual precipitation reaching 2601 mm (102 in). The seasons in Kwajalein bring significant changes in precipitation. The wettest month, October, receives heavy rainfall, with an average of 317 mm (12 in) of precipitation. This rainfall is distributed across 21 rainy days.
In contrast, the driest month, February, experiences much less rainfall, totaling 101 mm (4 in) over 20 rainy days. These distinct seasonal differences provide diverse experiences throughout the year. For more details, please visit our Kwajalein Precipitation page.
The mean monthly precipitation over the year, including rain, hail, and snow
The average number of days each month with precipitation
Water Temperature in Kwajalein
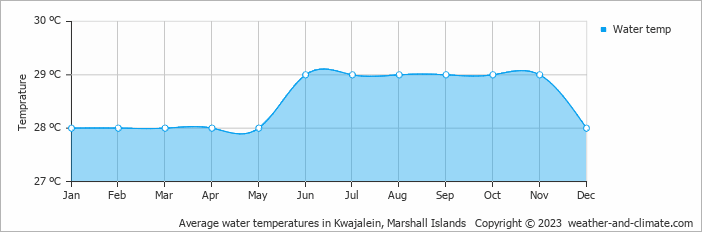
The mean water temperature over the year ranges from 28°C (82°F) in January to 29°C (84°F) in June.
Water temperature over the year
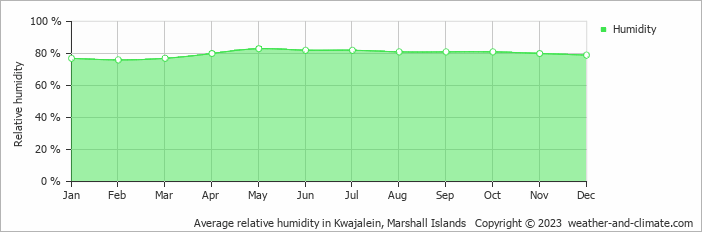
Humidity in Kwajalein by Month
The relative humidity is high throughout the year in Kwajalein.
The city experiences its highest humidity in May, reaching 83%. In February, the humidity drops to its lowest level at 76%. What does this mean? Read our detailed page on humidity levels for further details.
Relative humidity over the year
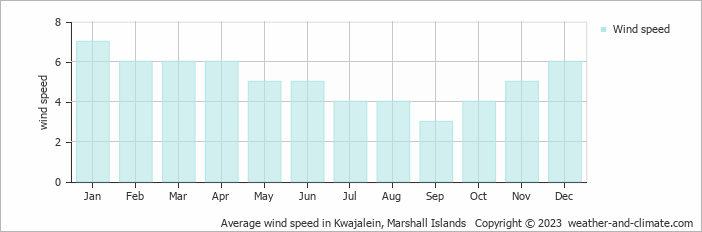
Wind Speed in Kwajalein
The mean wind speed varies between 3 m/s (6 knots) and 7 m/s (14 knots) throughout the year. It is lowest in September and highest during January. What does this mean?
The mean monthly wind speed over the year (meters per second)
Kwajalein 3-Day Forecast
Check the conditions for any month of the year.
Best Time to Visit Kwajalein
In general, temperatures in Kwajalein range from 29°C (84°F) to 29°C (84°F) across the year, with January and February being the best time to visit for those who prefer drier weather.Make your experience more enjoyable by planning to be outside during the cooler parts of the day, either early morning or as the sun begins to set. Visitors should note that May, June, July, August, September, October, November and December are part of the rainy season, bringing substantial rainfall. Seeking the perfect travel destination for this year? We've created a tool that suggests locations matching your desired weather. Let our weather planner guide your travel decisions.