Majuro Weather & Climate: Best Time to Visit
Average temperatures, rainfall, sunshine and the best time to visit Majuro.
Climate overview of Majuro
With consistently stable weather, Majuro, Marshall Islands, sees little seasonal temperature change. Daytime highs average 29°C (84°F), ranging from 29°C (84°F) in September to 29°C (84°F) in February.
Rainfall is high, totalling around 3371 mm (133 in) per year. October is the wettest month and March the driest. The most sunshine falls in March, with an average of 8.4 hours of daily sunshine.
Majuro Weather by Month
Pick a month to see the average temperature, rainfall and sunshine in Majuro - and find the best time to visit.
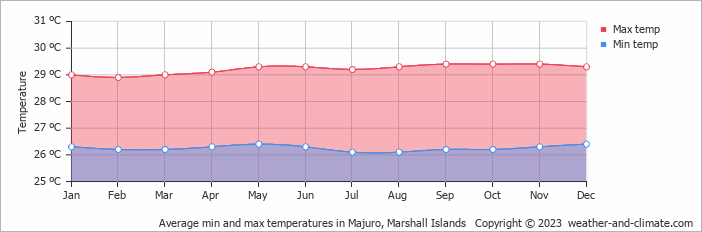
Monthly Temperature in Majuro
The climate in Majuro remains fairly constant, offering comfortable temperatures throughout the year. Average maximum daytime temperatures range from a comfortable 29°C (84°F) in September, the warmest time of the year, to a comfortable 29°C (84°F) during cooler months like February.
At night, you can expect temperatures ranging from 26°C (79°F) in September to around 26°C (79°F) during February.
Check out our detailed temperature page for more information.
Temperature ranges by month
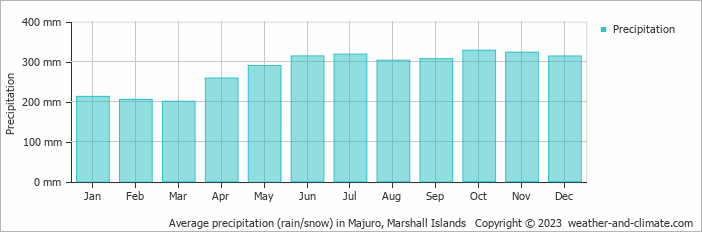
Rainfall in Majuro
Majuro is known for its substantial rainfall, with annual precipitation reaching 3371 mm (133 in). Year-round, Majuro has a balanced climate with minimal variation in precipitation. The difference between the wettest month, October, with 328 mm (13 in), and the driest month, March, with 200 mm (7.9 in), is minimal. For more details, please visit our Majuro Precipitation page.
The mean monthly precipitation over the year, including rain, hail, and snow
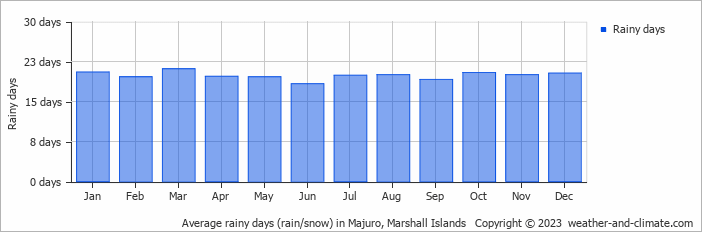
The average number of days each month with precipitation
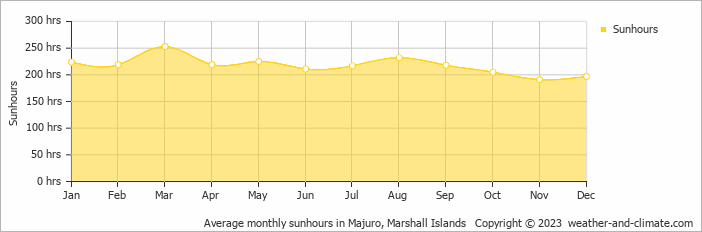
Sunshine Hours in Majuro
While the amount of sunshine in Majuro varies throughout the year, all seasons offer their own charm. Enjoy up to 8.4 hours of daily sun in March, and experience slightly darker atmosphere in November, with about 6.4 hours of daily sunlight.
Visit our detailed sunshine hours page for more information.
Monthly hours of sunshine
Daily hours of sunshine
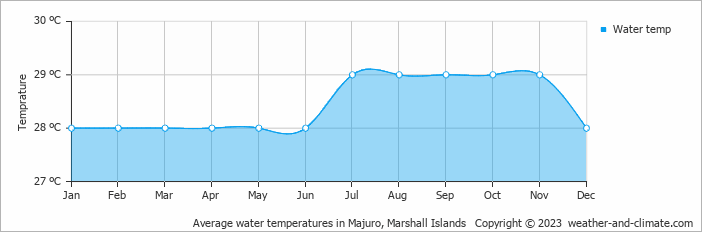
Water Temperature in Majuro
The mean water temperature over the year ranges from 28°C (82°F) in January to 29°C (84°F) in July.
Water temperature over the year
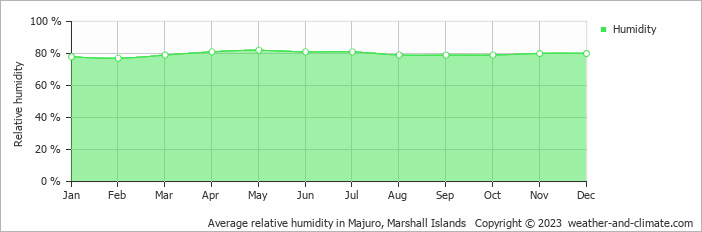
Humidity in Majuro by Month
The relative humidity is high throughout the year in Majuro.
The city experiences its highest humidity in May, reaching 82%. In February, the humidity drops to its lowest level at 77%. What does this mean? Read our detailed page on humidity levels for further details.
Relative humidity over the year
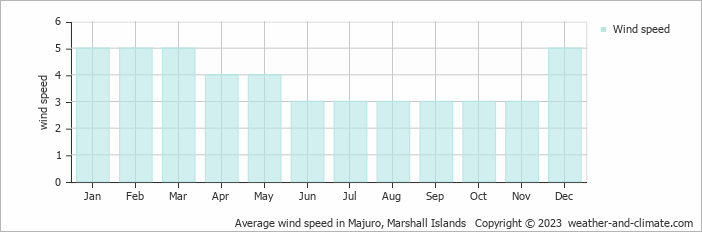
Wind Speed in Majuro
The mean wind speed over the year ranges from 3 m/s (6 knots) in June, July, August, September, October and November to 5 m/s (10 knots) in January, February, March and December. What does this mean?
The mean monthly wind speed over the year (meters per second)
Best Time to Visit Majuro
Monthly ratings reflect general weather comfort, based on daytime temperature and rainfall. Swimming and winter conditions are highlighted separately where relevant.
- Best overall: January, February, March and April
- Warmest weather: all year round
- Most sunshine: March
- Best for swimming: Any time of year. The sea stays pleasantly warm year-round.
Frequently asked questions about the climate in Majuro
What is the best time to visit Majuro?
January, February, March and April typically offer the most optimal weather in Majuro. In contrast, May, June, July, August, September, October, November and December tend to have less optimal conditions.
What temperatures can I expect in Majuro?
Daytime highs range from 29°C (84°F) in February to 29°C (84°F) in September. Nighttime lows range from 26°C (79°F) to 26°C (79°F). Temperatures stay relatively stable year-round.
How much rain does Majuro get?
Annual rainfall is around 3371 mm (133 in). October is the wettest month with 328 mm (13 in), while March is the driest with 200 mm (7.9 in).
How sunny is Majuro?
Majuro receives around 2,611 hours of sunshine per year. March is the sunniest month with 253 hours, while November is the cloudiest with just 191 hours. Overall, Majuro enjoys abundant sunshine.
Majuro 3-Day Forecast
Majuro on the map
Majuro is highlighted - select any city to see its climate.
Popular this month
Where to go in July - average daytime high across popular destinations.