














 Visit the Rainbow Mountains
The Rainbow Mountain (Vinicunca) is acolored rainbow mountain that will steal your heart forever and the view from the top will take your breath away.
Average temperatures, rainfall, sunshine and the best time to visit Juliaca.
 –
–
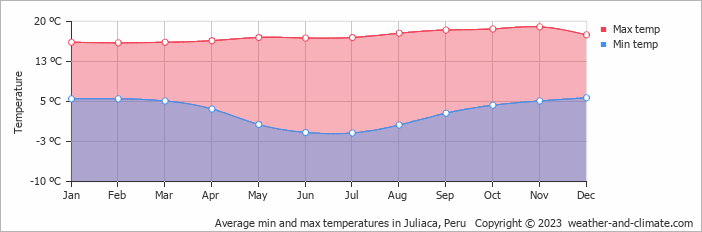
Juliaca, Arequipa, Peru, has a stable climate with little temperature variation across the year. Average daytime temperatures hover around 17°C (63°F), peaking in November at 19°C (66°F) and dipping in February to 16°C (61°F).
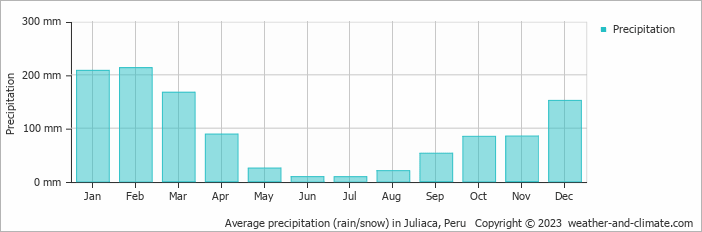
The city has a wet climate, receiving around 1113 mm (44 in) of rain/snowfall per year. Despite the high annual total, it has a distinct dry season from May to August. February is the wettest month.
Pick a month to see the average temperature, rainfall and sunshine in Juliaca - and find the best time to visit.
With minimal seasonal shifts, Juliaca experiences a constant climate year-round. On average, daytime temperatures range from a pleasant 19°C (66°F) in November to a moderate 16°C (61°F) in February.
Nighttime temperatures range from 6°C (43°F) in November to -1°C (30°F) in February.
Check out our detailed temperature page for more information.
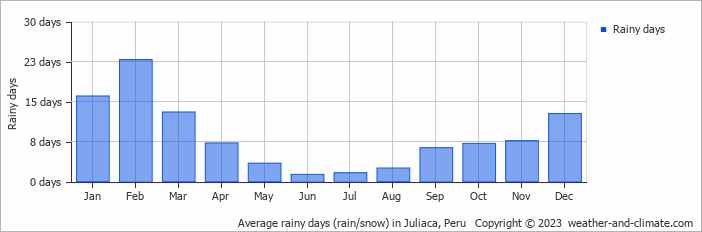
Juliaca has a notably wet climate with abundant precipitation, recording 1113 mm (44 in) of rain/snowfall per year. The seasons in Juliaca bring significant changes in precipitation. The wettest month, February, receives heavy rainfall, with an average of 213 mm (8.4 in) of precipitation. This rainfall is distributed across 23 rainy days.
In contrast, the driest month, July, experiences much less rainfall, totaling 8.6 mm (0.3 in) over 2 rainy days. These distinct seasonal differences provide diverse experiences throughout the year. For more details, please visit our Juliaca Precipitation page.
Monthly ratings reflect general weather comfort, based on daytime temperature and rainfall. Swimming and winter conditions are highlighted separately where relevant.
August typically offers the most optimal weather in Juliaca. In contrast, January and February tend to have less optimal conditions. Juliaca has a distinct dry season from May to August.
Daytime highs range from 16°C (61°F) in February to 19°C (66°F) in November. Nighttime lows range from -1°C (30°F) to 6°C (43°F). Temperatures stay relatively stable year-round.
Annual rainfall is around 1113 mm (44 in). February is the wettest month with 213 mm (8.4 in), while July is the driest with 8.6 mm (0.3 in).
Juliaca is highlighted - select any city to see its climate.
Where to go in October - average daytime high across popular destinations.
Iquitos 32°C (90°F) Trujillo22°C (72°F) Lima20°C (68°F) Arequipa
 20°C (68°F) Puno17°C (63°F) Cusco
 17°C (63°F) Machu Picchu16°C (61°F) Urubamba
 14°C (57°F)
 Need travel inspiration? Check out our bucket list articles and be inspired.
Visit the Rainbow Mountains
The Rainbow Mountain (Vinicunca) is acolored rainbow mountain that will steal your heart forever and the view from the top will take your breath away.
 "The other" Machu Picchu: the Inca City of Choquequirao
Discover Choquequirao, the hidden Inca city near Cusco. Hike through stunning landscapes and explore ancient ruins with fewer crowds than Machu Picchu.
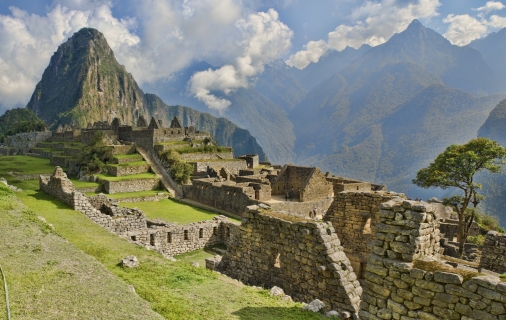 Hike the inca Trail
Few walking tours speak so much to the imagination as the Inca Trail to Machu Picchu. The tour leads through beautiful mountain landscapes and it is called the 'Royal Highway'
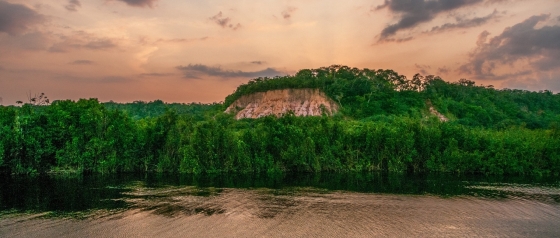 The Inkaterra Reserva Amazonica
One of your highlights during a trip in Peru might be this eco-luxury lodge in front of the Madre de Dios River, called Inkaterra Reserva Amazonica.