


















 Costa Rica in February: Pacific or Caribbean Coast?
Compare Costa Rica weather in February, from dry and sunny Tamarindo to wetter Puerto Viejo, plus Jacó, Arenal and San José.
On this page you find more information about the monthly relative humidity over the year in Tilarán (Guanacaste), Costa Rica.
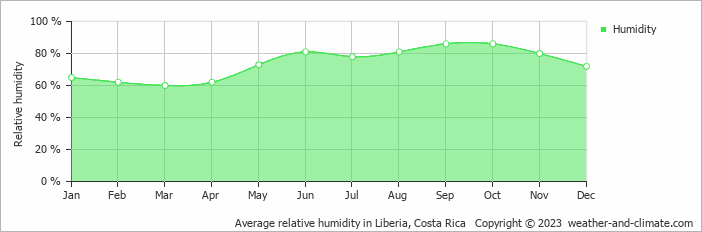
Tilarán's humidity levels vary throughout the year. The highest levels occur in September, reaching 86% (very high), while the lowest is recorded in March at 60%.
Throughout the year, the average humidity in Tilarán is 74%.
Humidity plays an important role in how temperatures are felt. During the warmest month, April, the maximum average temperature is around 32°C (90°F). Combined with high humidity during this period, the temperature can feel even warmer than the thermometer shows.
During the coldest month, January, the maximum average temperature is around 28°C (82°F). This period has high humidity. Check out our detailed temperature page for more information.
Pick a month to see the average temperature, rainfall and sunshine in Tilarán - and find the best time to visit.
Temperature Rainfall Sunshine Humidity
See the full Tilarán climate overview or explore weather in Costa Rica.
Where to go in October - average daytime high across popular destinations.
Tamarindo 30°C (86°F) Santa Teresa28°C (82°F) Cahuita29°C (84°F) Fortuna28°C (82°F) Puerto Viejo de Talamanca29°C (84°F) Herradura28°C (82°F) Jacó28°C (82°F) San José24°C (75°F)
 Need travel inspiration? Check out our bucket list articles and be inspired.
Costa Rica in February: Pacific or Caribbean Coast?
Compare Costa Rica weather in February, from dry and sunny Tamarindo to wetter Puerto Viejo, plus Jacó, Arenal and San José.
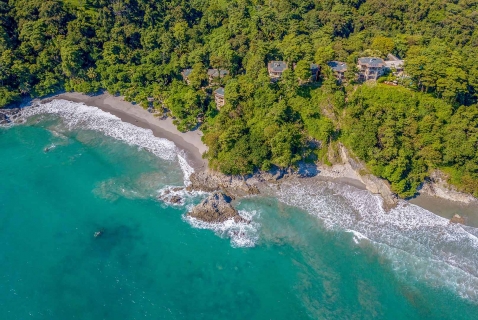 Where the rain forest meets the ocean
I promise that you will not find a better location, better views, nicer rooms or lovelier staff anywhere in Costa Rica. This place really goes above and beyond.
 Exploring Santa Teresa, Costa Rica: A Traveler's Guide
Immerse yourself in the laid-back charm of Santa Teresa, Costa Rica. Discover stunning beaches, vibrant dining spots, unique shops, and diverse activities in our comprehensive guide
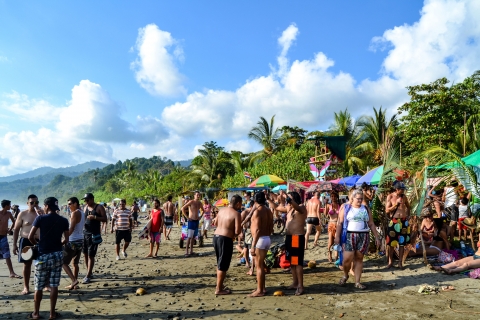 Envision Festival
This event happens once a year in Uvita de Puntarenas and attracts people from all over the world. This festival is a must add to your bucket list.