
















 Explore the Majestic Copper Canyons of Mexico
Explore the vast Copper Canyons in Chihuahua, Mexico—larger than the Grand Canyon. Discover scenic train rides, hikes, and the Tarahumara people.
On this page you find more information about the monthly relative humidity over the year in Tacámbaro de Codallos (Michoacan), Mexico.
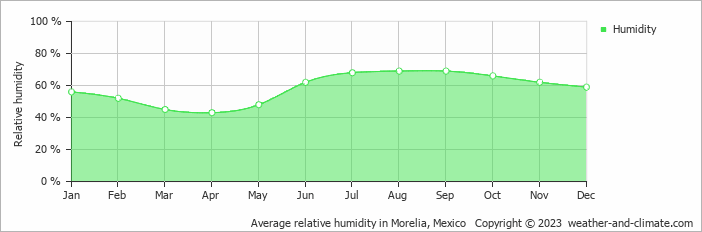
Tacámbaro de Codallos's humidity levels vary throughout the year. The highest levels occur in August, reaching 69% (high), while the lowest is recorded in April at 43%.
Throughout the year, the average humidity in Tacámbaro de Codallos is 58%.
Humidity plays an important role in how temperatures are felt. During the warmest month, April, the maximum average temperature is around 29°C (84°F). During this warm period, the moderate humidity levels have little impact on how the temperature is perceived.
During the coldest month, January, the maximum average temperature is around 24°C (75°F). This period has moderate humidity. Check out our detailed temperature page for more information.
Pick a month to see the average temperature, rainfall and sunshine in Tacámbaro de Codallos - and find the best time to visit.
Temperature Rainfall Sunshine Humidity
See the full Tacámbaro de Codallos climate overview or explore weather in Mexico.
Where to go in September - average daytime high across popular destinations.
Puerto Peñasco 34°C (93°F) Los Cabos
 32°C (90°F) Tulum31°C (88°F) Cancún30°C (86°F) Playa del Carmen31°C (88°F) Puerto Vallarta29°C (84°F) San Miguel de Allende
 27°C (81°F) Mexico City23°C (73°F)
 Need travel inspiration? Check out our bucket list articles and be inspired.
Explore the Majestic Copper Canyons of Mexico
Explore the vast Copper Canyons in Chihuahua, Mexico—larger than the Grand Canyon. Discover scenic train rides, hikes, and the Tarahumara people.
 These are the most beautiful Mayan ruins and Mayan temples in Mexico
Mexico is a destination where you can immerse yourself in ancient cultures and civilizations. In this article we have listed our favorite Mayan ruins.
 Tips, to-do's and nicest restaurants in Mexico City
Mexico City, one of the most famous and notorious cities of the world. The best time to visit is between March and May, but it can be visited year round.
 Zihuatanejo: A Pacific paradise with beautiful beaches
Zihuatanejo has some of Mexico's top beaches. Unlike other off-the-beaten-path destinations in Mexico, Zihua is very accessible and sustainable.