














 Visit the Rainbow Mountains
The Rainbow Mountain (Vinicunca) is acolored rainbow mountain that will steal your heart forever and the view from the top will take your breath away.
On this page you find more information about the monthly relative humidity over the year in Puerto Chicama (La Libertad), Peru.
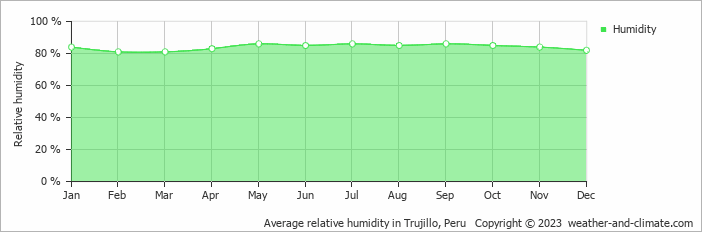
Puerto Chicama's humidity levels vary throughout the year. The highest levels occur in May, reaching 86% (very high), while the lowest is recorded in February at 81%.
Throughout the year, the average humidity in Puerto Chicama is 84%.
Humidity plays an important role in how temperatures are felt. During the warmest month, February, the maximum average temperature is around 27°C (81°F). Combined with very high humidity during this period, the temperature can feel even warmer than the thermometer shows.
During the coldest month, August, the maximum average temperature is around 21°C (70°F). This period has very high humidity. Check out our detailed temperature page for more information.
Pick a month to see the average temperature, rainfall and sunshine in Puerto Chicama - and find the best time to visit.
Temperature Rainfall Humidity
See the full Puerto Chicama climate overview or explore weather in Peru.
Where to go in October - average daytime high across popular destinations.
Iquitos 32°C (90°F) Trujillo
 22°C (72°F) Lima20°C (68°F) Arequipa
 20°C (68°F) Puno17°C (63°F) Cusco
 17°C (63°F) Machu Picchu16°C (61°F) Urubamba
 14°C (57°F)
 Need travel inspiration? Check out our bucket list articles and be inspired.
Visit the Rainbow Mountains
The Rainbow Mountain (Vinicunca) is acolored rainbow mountain that will steal your heart forever and the view from the top will take your breath away.
 "The other" Machu Picchu: the Inca City of Choquequirao
Discover Choquequirao, the hidden Inca city near Cusco. Hike through stunning landscapes and explore ancient ruins with fewer crowds than Machu Picchu.
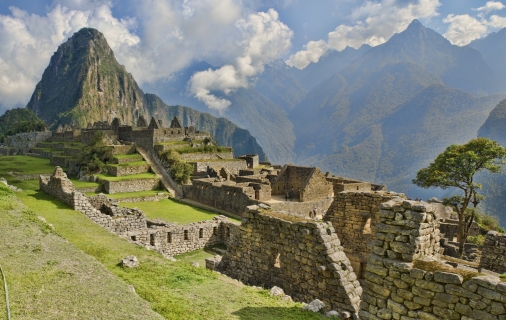 Hike the inca Trail
Few walking tours speak so much to the imagination as the Inca Trail to Machu Picchu. The tour leads through beautiful mountain landscapes and it is called the 'Royal Highway'
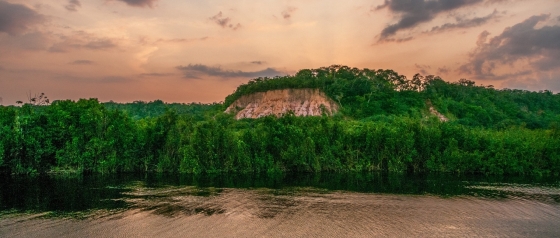 The Inkaterra Reserva Amazonica
One of your highlights during a trip in Peru might be this eco-luxury lodge in front of the Madre de Dios River, called Inkaterra Reserva Amazonica.