On this page you find more information about the monthly relative humidity over the year in Jitra (Kedah), Malaysia.
Data from: Langkawi, Malaysia (68 KM, 42 Miles).
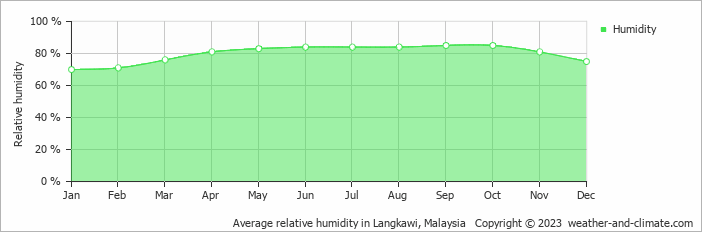
Jitra's humidity levels vary throughout the year. The highest levels occur in September, reaching 85% (very high), while the lowest is recorded in January at 70%.
Throughout the year, the average humidity in Jitra is 80%.
Humidity plays an important role in how temperatures are felt. During the warmest month, February, the maximum average temperature is around 35°C (95°F).
Combined with high humidity during this period, the temperature can feel even warmer than the thermometer shows.
During the coldest month, October, the maximum average temperature is around 31°C (88°F). This period has very high humidity.
Check out our detailed temperature page for more information.




















 Sabah, one of the most biodiverse regions in Malaysia