Jitra Weather & Climate: Best Time to Visit
Average temperatures, rainfall, sunshine and the best time to visit Jitra.
Climate overview of Jitra
Jitra, Kedah, Malaysia, enjoys a steady climate throughout the year, with daytime temperatures typically around 33°C (91°F). February is the warmest month at 35°C (95°F), while January is the coolest at 31°C (88°F).
With around 2263 mm (89 in) of annual rainfall, Jitra has a notably wet climate. However, this rainfall is not evenly distributed — the city has a distinct rainy season from April to November. The wettest month is October.
Jitra Weather by Month
Pick a month to see the average temperature, rainfall and sunshine in Jitra — and find the best time to visit.
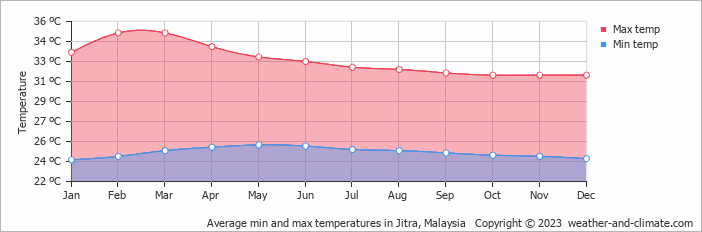
Monthly Temperature in Jitra
The temperature in Jitra remains steady throughout the year, providing a consistently very hot climate. Average daytime temperatures reach a very hot 35°C (95°F) in February. In January, the coolest month of the year, temperatures drop to a very warm 31°C (88°F).
At night, temperatures range from around 25°C (77°F) in February to 24°C (75°F) in January.
Check out our detailed temperature page for more information.
Temperature ranges by month
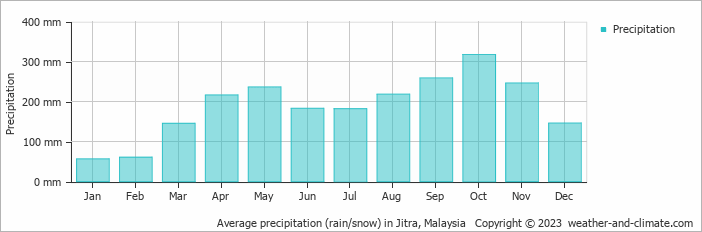
Rainfall in Jitra
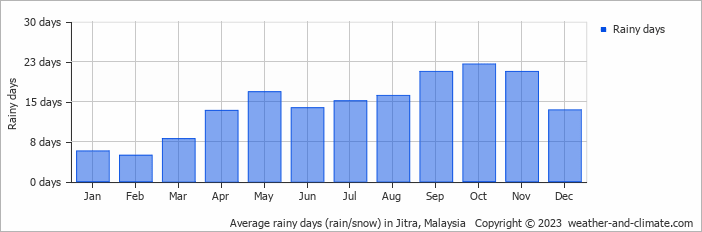
Jitra has a relatively rainy climate with high precipitation levels, averaging 2263 mm (89 in) of rainfall annually. Jitra can be quite wet during October, receiving approximately 317 mm (12 in) of precipitation over 22 rainy days.
In contrast, during the driest month (January), you will experience much drier conditions, with 56 mm (2.2 in) of precipitation spread across 6 rainy days days. For more details, please visit our Jitra Precipitation page.
The mean monthly precipitation over the year, including rain, hail, and snow
The average number of days each month with precipitation
Humidity in Jitra by Month
The relative humidity is high throughout the year in Jitra.
The city experiences its highest humidity in September, reaching 85%. In January, the humidity drops to its lowest level at 70%. What does this mean? Read our detailed page on humidity levels for further details.
Relative humidity over the year

Best Time to Visit Jitra
For a more comfortable experience, start your day early when the weather is cooler, or take advantage of the gentle breezes in the late afternoon.
The rainy season occurs during April, May, June, July, August, September, October and November, when the area experiences its heaviest rainfall. Wondering where to travel based on your weather preferences? Our recommendation tool helps you find destinations with your ideal climate conditions. Use our weather planner to find your perfect destination.
Frequently asked questions about the climate in Jitra
What is the best time to visit Jitra?
January and December typically offer the most optimal weather in Jitra. In contrast, February, March, April, May, June, July, August, September, October and November tend to have less optimal conditions. Jitra has a distinct rainy season from April to November.
What temperatures can I expect in Jitra?
Daytime highs range from 31°C (88°F) in January to 35°C (95°F) in February. Nighttime lows range from 24°C (75°F) to 25°C (77°F). Temperatures stay relatively stable year-round.
How much rain does Jitra get?
Annual rainfall is around 2263 mm (89 in). October is the wettest month with 317 mm (12 in), while January is the driest with 56 mm (2.2 in).
Jitra 3-Day Forecast
Jitra 3-Day Forecast
Jitra on the map
Jitra is highlighted — select any city to see its climate.
Popular this month
Where to go in July — average daytime high across popular destinations.
Bucket list
Need travel inspiration? Check out our bucket list articles and be inspired.
 Sabah, one of the most biodiverse regions in Malaysia
Sabah is one of the most biodiverse areas in the entire region. You will find some of the world's oldest rain forests full of rare animals and spectacular natural phenomena. For lovers of nature and wildlife this place is paradise.
Rainforest World Music Festival
The Rainforest World Music Festival (often abbreviated as RWMF) is an annual three-day music festival celebrating the diversity of world music, held in Kuching, Sarawak, Malaysia.