Average monthly water temperature in Urunga, Australia
On this page you find the mean water temperature over the year in Urunga (), Australia. Discover the unique water temperature patterns, from its warmest to its coolest months.
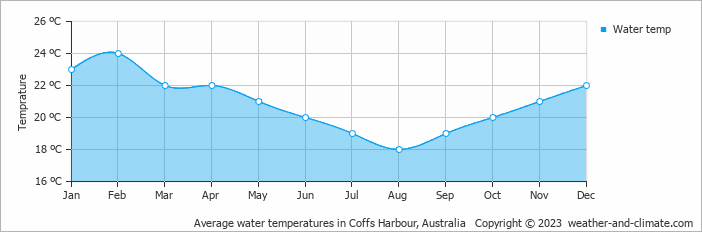
Data from: Coffs Harbour, Australia (22 KM, 13 Miles).
Water temperatures in Urunga fluctuate across the seasons. The warmest month, February, averages 24°C (75°F).
The coldest water temperature month is August, averaging 18°C (64°F). Seasonal shifts offer opportunities to explore different activities depending on the time of year.