














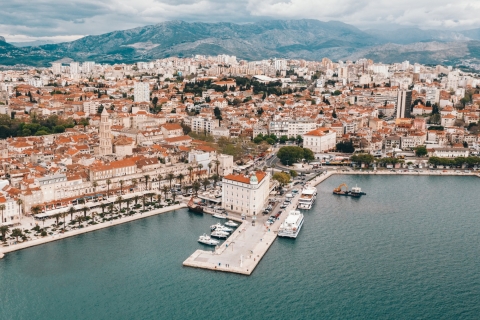
 Magical Split
The best travel time to Split in Croatia is from May til October and the best months are May, June and September.
On this page you find the mean water temperature over the year in Turan (), Croatia. Take a closer look at the water temperature patterns and what they mean for swimming and recreation.
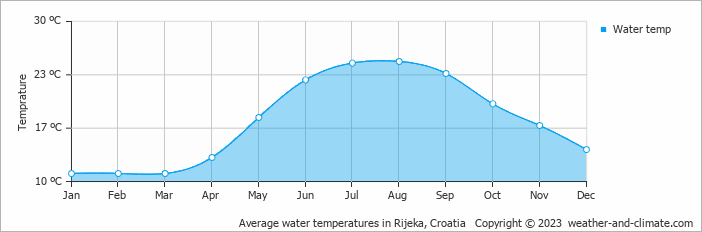
Turan experiences water temperature shifts throughout the year. The warmest month, August, reaches an average of 25°C (77°F).
The coldest month, January, averages 11°C (52°F). Visitors during these months can leave their swimming gear at home.
Pick a month to see the average temperature, rainfall and sunshine in Turan - and find the best time to visit.
Temperature Rainfall Sunshine Humidity Water Temp
See the full Turan climate overview or explore weather in Croatia.
Where to go in October - average daytime high across popular destinations.
Trogir 20°C (68°F) Zadar
 21°C (70°F) Makarska
 20°C (68°F) Poreč19°C (66°F) Rovinj19°C (66°F) Pula19°C (66°F) Split20°C (68°F) Dubrovnik20°C (68°F)
 Need travel inspiration? Check out our bucket list articles and be inspired.
Magical Split
The best travel time to Split in Croatia is from May til October and the best months are May, June and September.
 Sail the crystal-clear waters of Croatia and enjoy its stunning coastline
Croatia is an idyllic sailing destination, boasting 1,777 miles (2,860 km) of beautiful beaches and pristine waters. With over 1,000 Islands dotting the Adriatic Sea, there's a perfect spot for everyone.
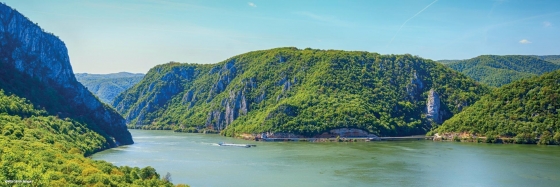
 Cycle the Danube trail
The Danube cycle route is one of the most popular cycling routes in Europe, and rightly so, because it is a varied route that is interesting both in terms of culture and nature.

 The 10 most charming villages in France
Discover France's top 10 beautiful villages. From Normandy to the Côte d'Azur, experience quaint squares and cobbled streets. Which one will you visit this summer?