


















 The 10 most alternative cities in South America
Discover South America's top 10 alternative cities! From Valparaíso's vibrant streets to La Paz's high-altitude charm and Medellín's innovative spirit.
On this page you find the mean water temperature over the year in El Pinar (), Uruguay. Discover when the water is at its warmest and coolest, perfect for planning your visit.
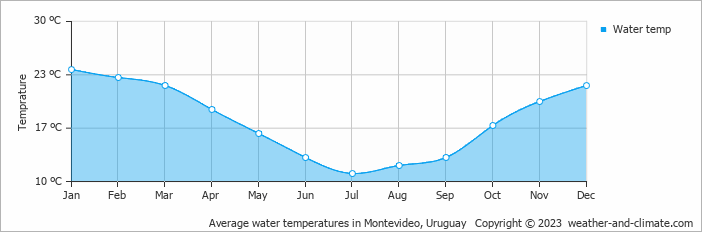
In El Pinar, the water undergoes seasonal changes. The warmest month is January, with an average water temperature of 24°C (75°F).
The coldest water temperature month, July, has an average temperature of 11°C (52°F). It may not be the ideal time for a swim.
Pick a month to see the average temperature, rainfall and sunshine in El Pinar - and find the best time to visit.
Temperature Rainfall Sunshine Humidity Wind Speed Water Temp
See the full El Pinar climate overview or explore weather in Uruguay.
Where to go in October - average daytime high across popular destinations.
 Colonia del Sacramento
 21°C (70°F) Montevideo20°C (68°F) La Pedrera19°C (66°F) José Ignacio19°C (66°F) Piriápolis19°C (66°F) La Paloma19°C (66°F) Punta Del Diablo19°C (66°F) Punta del Este18°C (64°F)
 Need travel inspiration? Check out our bucket list articles and be inspired.
The 10 most alternative cities in South America
Discover South America's top 10 alternative cities! From Valparaíso's vibrant streets to La Paz's high-altitude charm and Medellín's innovative spirit.
 Carmelo is the best kept secret of Uruguay
With its natural beauty and history, Carmelo is an inviting place to visit. Enjoy nature, tranquility, authenticity, the 'wine' and activities such as cycling, walking and horse riding.

 Visit the Rainbow Mountains
The Rainbow Mountain (Vinicunca) is acolored rainbow mountain that will steal your heart forever and the view from the top will take your breath away.

 The 5 most tranquil retreats in the Amazon Rainforest, Brazil
Discover top sustainable lodges in the Amazon. Enjoy unique wildlife, eco-friendly stays, and immersive experiences at Anavilhanas, Cristalino, and more.