El Pinar Weather & Climate: Best Time to Visit
Average temperatures, rainfall, sunshine and the best time to visit El Pinar.
Climate overview of El Pinar
The climate in El Pinar, Uruguay, is marked by large temperature swings across the seasons, ranging from 28°C (82°F) in January to 15°C (59°F) in July.
The city has a wet climate, receiving around 1163 mm (46 in) of rainfall per year. October is the wettest month. January is the sunniest month, averaging 9.8 hours of sunshine per day.
El Pinar Weather by Month
Pick a month to see the average temperature, rainfall and sunshine in El Pinar — and find the best time to visit.
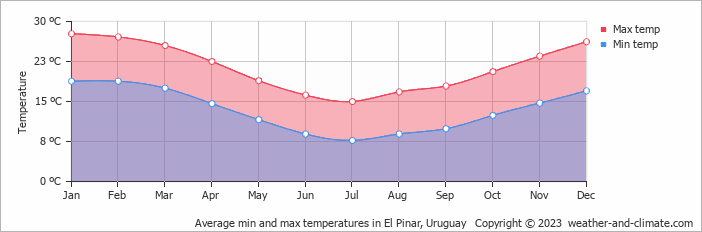
Monthly Temperature in El Pinar
In El Pinar, temperatures differ significantly between summer and winter months. On average, daytime temperatures range from a comfortable 28°C (82°F) in January to a moderate 15°C (59°F) in July.
Nighttime temperatures range from 19°C (66°F) in January to 8°C (46°F) in July.
Check out our detailed temperature page for more information.
Temperature ranges by month
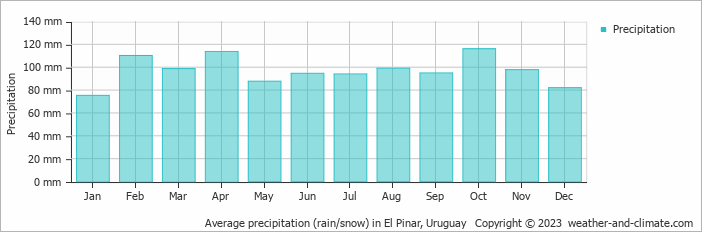
Rainfall in El Pinar
El Pinar experiences significant rainfall throughout the year, averaging 1163 mm (46 in) of precipitation annually. The wettest period in El Pinar occurs in October, which receives around 116 mm (4.6 in) of precipitation. During the driest month, January, El Pinar experiences moderate rainfall, totaling 75 mm (3 in). The consistent precipitation levels throughout the year contribute to a relatively stable climate. For more details, please visit our El Pinar Precipitation page.
The mean monthly precipitation over the year, including rain, hail, and snow
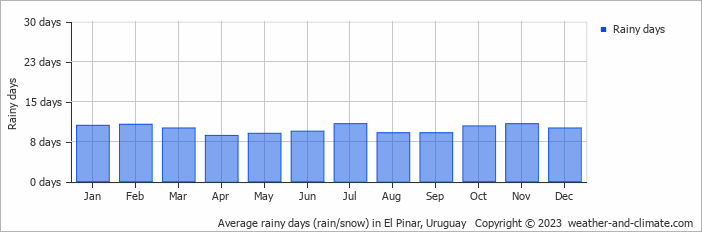
The average number of days each month with precipitation
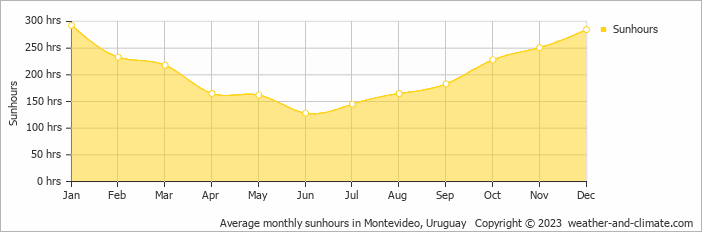
Sunshine Hours in El Pinar
In El Pinar, summer days are longer and more sunny, with daily sunshine hours peaking at 9.8 hours in January. As the darker season arrives, the brightness of the sun becomes less. June sees a soft sun for only 4.3 hours per average day.
Visit our detailed sunshine hours page for more information.
Monthly hours of sunshine
Daily hours of sunshine
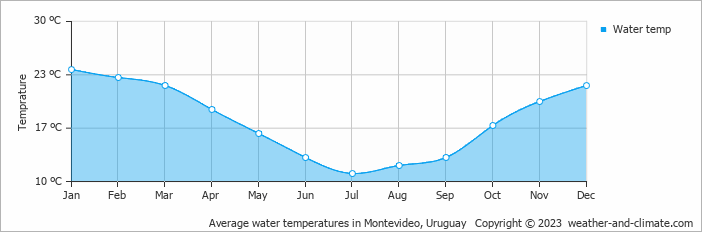
Water Temperature in El Pinar
The mean water temperature over the year ranges from 11°C (52°F) in July to 24°C (75°F) in January.
Water temperature over the year
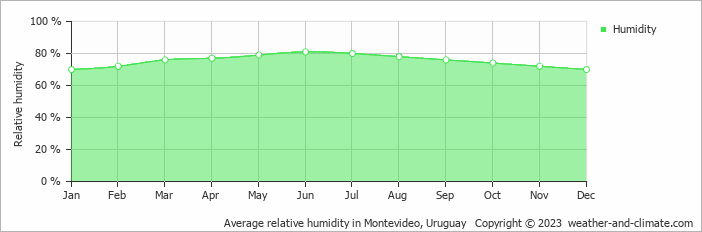
Humidity in El Pinar by Month
The relative humidity is high throughout the year in El Pinar.
The city experiences its highest humidity in June, reaching 81%. In January, the humidity drops to its lowest level at 70%. What does this mean? Read our detailed page on humidity levels for further details.
Relative humidity over the year
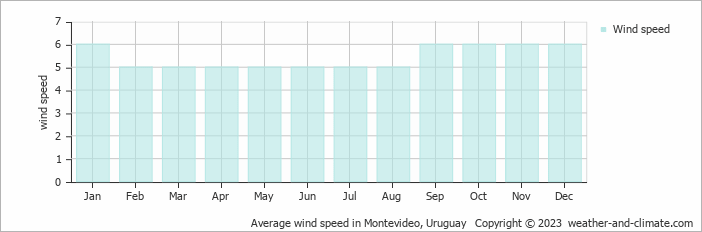
Wind Speed in El Pinar
The average wind speed over the year ranges from 5 m/s (10 knots) to 6 m/s (12 knots). It is lower in February, March, April, May, June, July and August and higher in January, September, October, November and December. What does this mean?
The mean monthly wind speed over the year (meters per second)
Best Time to Visit El Pinar
Frequently asked questions about the climate in El Pinar
What is the best time to visit El Pinar?
January, March, November and December typically offer the most optimal weather in El Pinar. In contrast, June, July and August tend to have less optimal conditions.
What temperatures can I expect in El Pinar?
Daytime highs range from 15°C (59°F) in July to 28°C (82°F) in January. Nighttime lows range from 8°C (46°F) to 19°C (66°F). Temperatures vary considerably through the year.
How much rain does El Pinar get?
Annual rainfall is around 1163 mm (46 in). October is the wettest month with 116 mm (4.6 in), while January is the driest with 75 mm (3 in).
How sunny is El Pinar?
El Pinar receives around 2,456 hours of sunshine per year. January is the sunniest month with 293 hours, while June is the cloudiest with just 128 hours. Overall, El Pinar enjoys abundant sunshine.
El Pinar 3-Day Forecast
El Pinar 3-Day Forecast
El Pinar on the map
El Pinar is highlighted — select any city to see its climate.
Popular this month
Where to go in June — average daytime high across popular destinations.
Bucket list
Need travel inspiration? Check out our bucket list articles and be inspired.
 The 10 most alternative cities in South America
Discover South America's top 10 alternative cities! From Valparaíso's vibrant streets to La Paz's high-altitude charm and Medellín's innovative spirit.
 Carmelo is the best kept secret of Uruguay
With its natural beauty and history, Carmelo is an inviting place to visit. Enjoy nature, tranquility, authenticity, the 'wine' and activities such as cycling, walking and horse riding.