ClimateForecastAprilMay >>

Climate in Boca Chica (Greater Santo Domingo), Dominican Republic

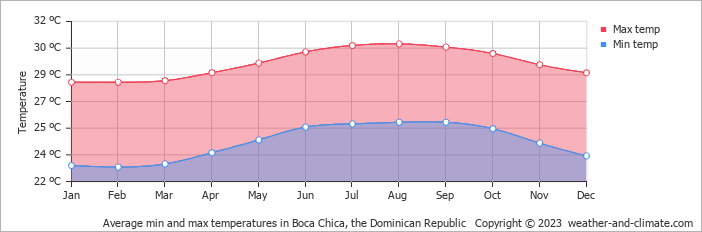
The graphs below show the monthly weather averages over the year.

Average day and night temperature

The mean minimum and maximum temperatures over the year.

Average monthly minimum and maximum temperature in Boca Chica, the Dominican Republic

Feel free to add this climate graph to your website. Click the copy button above.

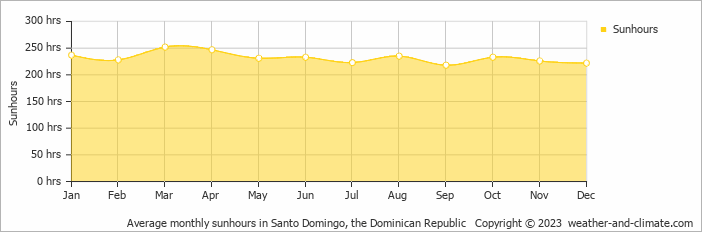
Monthly hours of sunshine

The average monthly total hours of sunshine over the year

Average monthly hours of sunshine in Boca Chica, the Dominican Republic

Feel free to add this climate graph to your website. Click the copy button above.

* Data from: Santo Domingo, the Dominican Republic (29 KM, 18 Miles).

Monthly precipitation

The mean monthly precipitation over the year, including rain, snow, hail etc.

Average monthly rainfall, snow, precipitation in Boca Chica, the Dominican Republic

Feel free to add this climate graph to your website. Click the copy button above.

Monthly rainy days

The average number of days each month with rain, snow, hail etc.

Average monthly rainy days in Boca Chica, the Dominican Republic

Feel free to add this climate graph to your website. Click the copy button above.

Average humidity

The mean monthly relative humidity over the year

Average monthly relative humidity in Boca Chica, the Dominican Republic

Feel free to add this climate graph to your website. Click the copy button above.

* Data from: Santo Domingo, the Dominican Republic (29 KM, 18 Miles).

Weather Forecasts for Boca Chica

Fri   Apr 19
33°C | 21°C
NE 14 km/h
0.9 mm
partly cloudy and  chance of rain

partly cloudy and chance of rain

Sat   Apr 20
32°C | 20°C
NE 14 km/h
3 mm
partly cloudy and rain

partly cloudy and rain

Sun   Apr 21
33°C | 20°C
NE 14 km/h
1.1 mm
partly cloudy and rain

partly cloudy and rain

The best time of year to visit Boca Chica in the Dominican Republic

The best time to visit is during the drier months: January, February and March.

Other facts from our historical weather data:

  • Which is the hottest month in Boca Chica?
    August has an average maximum temperature of 31°C and is the hottest month of the year.
  • Which is the coolest month in Boca Chica?
    The coolest month is February with an average maximum temperature of 28°C.
  • Which is the wettest month in Boca Chica?
    September tops the wettest month list with 164 mm of rainfall.
  • Which is the driest month in Boca Chica?
    February is the driest month with 38 mm of precipitation.
  • Which is the sunniest month in Boca Chica?
    March is the sunniest month with an average of 252 hours of sunshine.

  • No idea where to travel to this year? We have a tool that recommends destinations based on your ideal conditions. Find out where to go with our weather planner.