Climate ▸Forecast ▸June ▸July ▸
JanuaryFebruaryMarchAprilMayJuneJulyAugustSeptemberOctoberNovemberDecember

Average monthly water temperature in Reykjavík, Iceland

On this page you find the mean water temperature over the year in Reykjavík (Capital Region), Iceland. Dive into the water temperature trends, highlighting the best times for swimming and other activities.
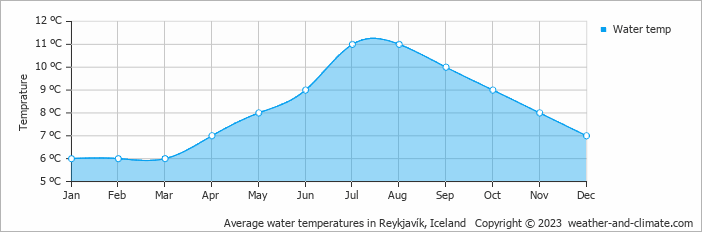
Water temperatures in Reykjavík stay on the cooler side throughout the year. The warmest month, August, averages 11°C.

The coldest water temperature month is March, averaging 6°C. These cooler conditions are not the best for swimming enthusiasts.


Forecast for Reykjavík

Wednesday
18 Jun
Rain
Rain
9°C
3.6 mm
Thursday
19 Jun
Cloudy
Cloudy
11°C
0.5 mm
Friday
20 Jun
Light rain showers
Light rain showers
11°C
1.5 mm

Interested in more climate information?

This site provides you with all the information you need about the climate in Reykjavík.

Our site offers climate and forecast data for every country in the world. Are you going to Iceland? On this website you can find historical weather averages for many cities in Iceland. Not sure yet where to go? We now have a tool which recommends destinations that suit your ideal travel conditions. Find out where to go with our weather planner.

) ?>