Žiar nad Hronom Monthly Rainfall & Precipitation
This page shows both the average monthly rainfall and the number of rainy days in Žiar nad Hronom, Banskobystrický kraj, Slovakia. These values are calculated using 30 years of data (1990–2020) to ensure accuracy. Now, let's explore all the details to give you a full picture.
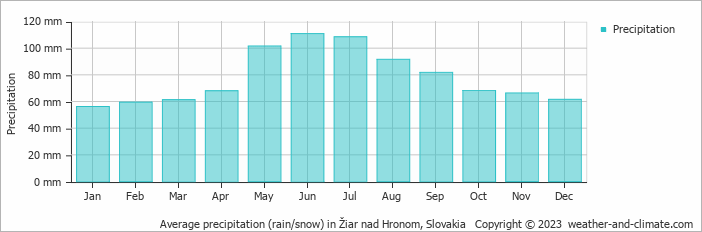
Generally, Žiar nad Hronom experiences moderate precipitation patterns, averaging 934 mm (37 in) yearly.
Monthly Precipitation Levels
The average number of days each month with precipitation (> 0.2 mm (0.01 in))
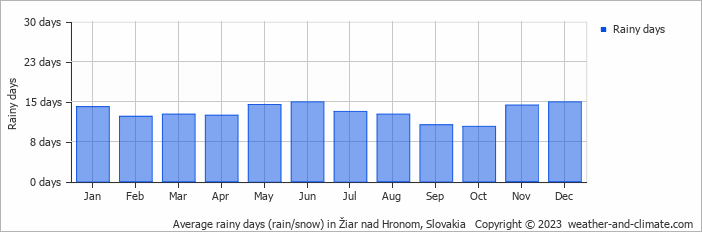
While rainfall varies throughout the year, each season offers its own charm. June brings wetter days averaging 111 mm (4.4 in) of precipitation, spread over 15 rainy days.
In contrast, January experiences a drier climate, with about 56 mm (2.2 in) of snow/rainfall spread across 14 snowy/rainy days.
June, the wettest month, has a maximum daytime temperature of 23°C (73°F). The city receives 209 hours of sunshine in this period. During the driest month January you can expect a temperature of 2°C (36°F). For more detailed insights into the city's temperatures, visit our Žiar nad Hronom Temperature page.
Annual Rainfall in Slovakia: City Comparison
The map below shows the annual precipitation across Slovakia. You can also select the different months in case you are interested in a specific month.
 heavy rainfall
 high
high
 moderate
 low
low
 almost none
Žiar nad Hronom vs World: Rainfall Compared
Žiar nad Hronom's average annual precipitation is 934 mm (37 in). Let's compare this to some popular worldwide tourist destinations:
The city of Rome, Italy, has an average annual precipitation of 832 mm (33 in), spread fairly evenly throughout the year.
Meanwhile, Buenos Aires, Argentina, enjoys a humid subtropical climate with 1000 mm (39 in) of annual rainfall, mostly in the summer.
In Brisbane, Australia, the annual precipitation is 979 mm (39 in), making it wetter than Sydney.
Singapore, situated near the equator, gets 2581 mm (102 in) of rainfall annually, with no distinct dry season and consistent monthly precipitation.
Precipitation amounts are measured using specific gauges installed at weather stations, collecting both rain and snow and any other type of precipitation. Rainfall is measured directly in millimeters, while that from snow and ice is obtained by melting it. Automated systems often incorporate heaters to make this easier.
Information from these stations is transmitted via Wi-Fi, satellite, GPS, or telephone connections to central monitoring networks. This information is immediately updated and integrated into weather models and forecasts.
Tropical Rainforests: In tropical regions, rainfall is generally abundant year-round. Areas near the equator, like the Amazon rainforest, can receive up to 3000 mm (118 in) of rain annually.
Desert Regions: Deserts such as the Sahara and Arabian deserts typically see less than 250 mm (9.8 in) of rainfall annually. Rainfall tends to be infrequent, but when it does occur, it is often intense.
Temperate Zones: In temperate regions, precipitation tends to be more evenly distributed, though areas closer to the ocean may see more rain in the winter months, and areas further inland experience drier summers.
Polar Regions: Precipitation in polar regions, like Antarctica, is extremely low, often falling as snow. Average annual precipitation in Antarctica is less than 200 mm (7.9 in), with some areas receiving as little as 50 mm (2 in) annually.
- The U.S. has a significant number of thunderstorms every year, with over 14.6 million taking place across the world annually.
- Approximately 70% of lightning bolts strike land rather than oceans.
- A storm named John was the longest-lasting Pacific tropical storm, continuing for 31 days. As it crossed the dateline twice, it changed status from a hurricane to a typhoon and back to a hurricane.
For more detailed information about Žiar nad Hronom's weather, including sunshine hours, humidity levels, and temperature data, visit our Žiar nad Hronom Climate page.


