Villarosa Rainfall & Precipitation: Monthly Averages and Year-Round Insights
This page shows the average amount of rainfall per month in Villarosa. The numbers are calculated over a 30-year period to provide a reliable average. Now, let’s break down all the details for a clearer picture.
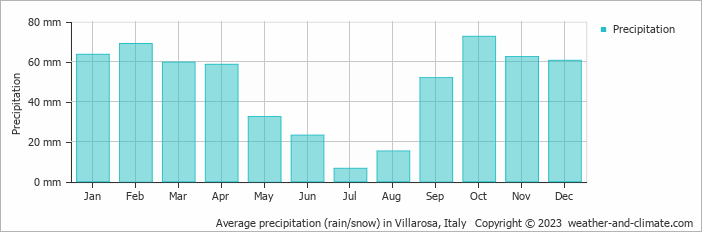
On average, Villarosa receives a reasonable amount of rainfall, with an annual precipitation of 575 mm.
Monthly Precipitation Levels
The average number of days each month with precipitation (> 0.2 mm)
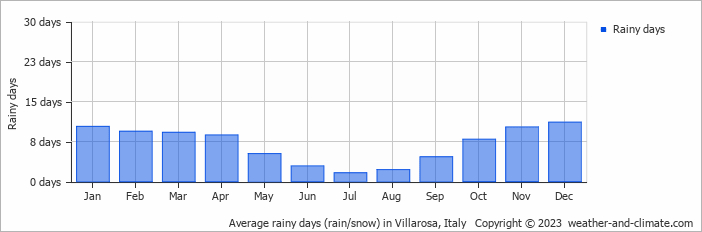
The climate in Villarosa shows significant variation throughout the year. Expect 73 mm of precipitation during the wettest month October, distributed over 8 rainy days.
In contrast, July offers drier and sunnier days, with around 6.5 mm of rainfall over 2 rainy days.October, the wettest month, has a maximum daytime temperature of 23°C. The city receives 215 hours of sunshine in this period. During the driest month July you can expect a temperature of 31°C. For more detailed insights into the city’s temperatures, visit our Villarosa Temperature page.
Annual Precipitation in Italy
The map below shows the annual precipitation across Italy. You can also select the different months in case you are interested in a specific month.


 heavy rainfall
 high
high
 moderate
 low
low
 almost none
Amsterdam Precipitation Compared World Wide
Villarosa’s average annual precipitation is 575 mm. Let’s compare this to some popular worldwide tourist destinations:
In Barcelona, Spain, the average annual precipitation is 620 mm, evenly distributed across the year with no extreme wet or dry seasons.
Meanwhile, Buenos Aires, Argentina, enjoys a humid subtropical climate with 1000 mm of annual rainfall, mostly in the summer.
Melbourne, Australia, has 690 mm of rainfall annually, spread fairly evenly throughout the year.
Ho Chi Minh City, Vietnam, receives 1955 mm of annual rainfall, with a pronounced wet season from May to November, typical of its tropical monsoon climate.
How is Precipitation Measured?
Precipitation amounts are measured using specific gauges installed at weather stations, collecting both rain and snow and any other type of precipitation. Rainfall is measured directly in millimeters, while that from snow and ice is obtained by melting it. Automated systems often incorporate heaters to make this easier.
Information from these stations is transmitted via Wi-Fi, satellite, GPS, or telephone connections to central monitoring networks. This information is immediately updated and integrated into weather models and forecasts.
Interesting weather facts
- Mawsynram in India is noted as being the wettest place on earth, with over 11 meters of rain falling every year.
- In contrast, Antofagasta in Chile is among the driest places on the planet, getting less than 0.1mm per year, with some years recording virtually no rainfall.
- Nearly 1,650 thunderstorm cells are estimated over the planet at any given time.
For more detailed information about Villarosa’s weather, including sunshine hours, humidity levels, and temperature data, visit our Villarosa Climate page.
Current rainfall in Villarosa


