Siolim Monthly Rainfall & Precipitation
This page shows both the average monthly rainfall and the number of rainy days in Siolim, Goa, India. The numbers reflect climate data gathered over a 30-year period, from 1990 to 2020. Let's now guide you through the details for a complete overview.
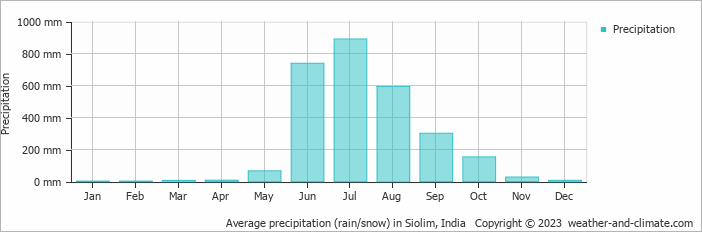
Siolim is known for its substantial rainfall, with annual precipitation reaching 2786 mm (110 in). While the overall climate is wet, there are notable seasonal patterns that create interesting contrasts, as demonstrated in our graph below.
Monthly Rainfall & Rainy Days
Monthly Precipitation Levels
The average number of days each month with precipitation (> 0.2 mm (0.01 in))
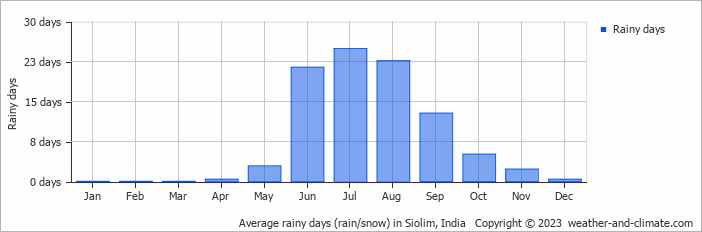
The seasons in Siolim, bring significant changes in precipitation. The wettest month, July, receives heavy rainfall, with an average of 890 mm (35 in) of precipitation. This rainfall is distributed across 25 rainy days.
In contrast, the driest month, February, experiences much less rainfall, totaling 1 mm (0.04 in) over 0 rainy days. These distinct seasonal differences provide diverse experiences throughout the year.July, the wettest month, has a maximum daytime temperature of 29°C (84°F). The city receives 106 hours of sunshine in this period. During the driest month February you can expect a temperature of 31°C (88°F). For more detailed insights into the city's temperatures, visit our Siolim Temperature page.
Annual Rainfall in India: City Comparison
The map below shows the annual precipitation across India. You can also select the different months in case you are interested in a specific month.
Siolim vs World: Rainfall Compared
Siolim's average annual precipitation is 2786 mm (110 in). Let's compare this to some popular worldwide tourist destinations:
Seville, Spain, experiences 541 mm (21 in) of rainfall annually, with wet winters and dry summers typical of southern Spain.
Osaka, Japan, experiences 1507 mm (59 in) of rainfall annually, spread across the year with wetter summers.
Melbourne, Australia, has 690 mm (27 in) of rainfall annually, spread fairly evenly throughout the year.
Bangkok, Thailand, experiences a tropical monsoon climate with 1668 mm (66 in) of annual rainfall, with the heaviest precipitation occurring during September and October.
Precipitation amounts are measured using specific gauges installed at weather stations, collecting both rain and snow and any other type of precipitation. Rainfall is measured directly in millimeters, while that from snow and ice is obtained by melting it. Automated systems often incorporate heaters to make this easier.
Information from these stations is transmitted via Wi-Fi, satellite, GPS, or telephone connections to central monitoring networks. This information is immediately updated and integrated into weather models and forecasts.
Climate change is affecting precipitation patterns worldwide, including Siolim:
- Changing Rainfall Patterns: Global warming causes drastic changes in the patterns of rainfall. Some areas have been experiencing increased frequency and intensity of rainfall, while other areas experience longer dry spells or even droughts.
- Local Impacts: Many regions are experiencing heavier rainfall in the winter months and drier, hotter summers. This affects agriculture, water resources, and ecosystems.
- The U.S. has a significant number of thunderstorms every year, with over 14.6 million taking place across the world annually.
- Approximately 70% of lightning bolts strike land rather than oceans.
- A storm named John was the longest-lasting Pacific tropical storm, continuing for 31 days. As it crossed the dateline twice, it changed status from a hurricane to a typhoon and back to a hurricane.
For more detailed information about Siolim's weather, including sunshine hours, humidity levels, and temperature data, visit our Siolim Climate page.
Siolim Weather by Month
Pick a month to see the average temperature, rainfall and sunshine in Siolim - and find the best time to visit.
Siolim 3-Day Forecast
Temperature Rainfall Sunshine Humidity Wind Speed
See the full Siolim climate overview or explore weather in India.
Popular this month
Where to go in July - average daytime high across popular destinations.
Bucket list
Need travel inspiration? Check out our bucket list articles and be inspired.
 A paradise called Andaman Islands
Though officially Indian, the Andamans are nearer Myanmar, Indonesia, and Thailand, resulting in amazing, budget-friendly white-sand beaches.
The 5 most beautiful monasteries in Ladakh
Explore Ladakh's spiritual essence through its incredible Buddhist monasteries. See architectural wonders, rich traditions, and serene landscapes in this guide.
Sleeping under the stars and riding camels in Rajasthan
A desert safari in Jaisalmer is definitely one of the highlights during a visit to India. Spending a night in the desert is a great adventurous bucket list experience.
Avoid mass tourism on an eco boat in the backwaters of Kerala
We can tell you now how you can avoid being surrounded by tourists and at the same time minimize your impact on the environment.