San Pedro de Macorís Monthly Rainfall & Precipitation
This page shows both the average monthly rainfall and the number of rainy days in San Pedro de Macorís, Greater Santo Domingo, Dominican Republic. Long-term data from 1990 to 2020 was used to calculate these averages. Now, let's explore all the details to give you a full picture.
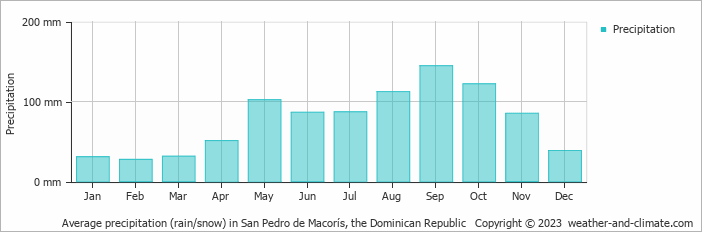
Generally, San Pedro de Macorís receives mid-range precipitation levels, with 918 mm (36 in) annually. The distribution varies significantly throughout the year, with a distinct dry season during certain months, as shown in our charts below.
Monthly Precipitation Levels
The average number of days each month with precipitation (> 0.2 mm (0.01 in))
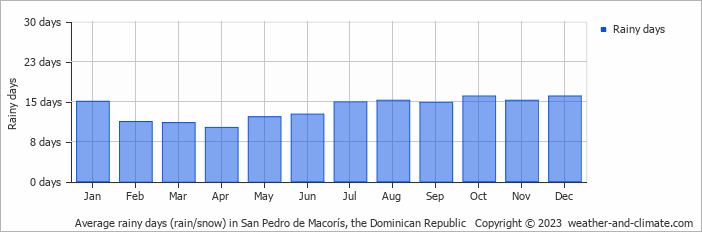
Significant seasonal changes in precipitation occur throughout the year. During the wettest month, September receives substantial rainfall, averaging 145 mm (5.7 in) of precipitation, recorded across 15 rainy days.
In contrast, the driest month, February brings less rainfall, with 28 mm (1.1 in) over 11 rainy days.
September, the wettest month, has a maximum daytime temperature of 31°C (88°F). The city receives 218 hours of sunshine in this period. During the driest month February you can expect a temperature of 28°C (82°F). For more detailed insights into the city's temperatures, visit our San Pedro de Macorís Temperature page.
Daily Historical Precipitation
48-year average (1976-2025)
Average daily rainfall for each day of the month based on long-term records.
Average precipitation in July
Explore San Pedro de Macorís's Historical Precipitation: 1976-2026
Browse day-by-day precipitation records for San Pedro de Macorís spanning 51 years. Select any month and year to see actual rainfall and snowfall recorded on each day.
Annual Rainfall in the Dominican Republic: City Comparison
The map below shows the annual precipitation across the Dominican Republic. You can also select the different months in case you are interested in a specific month.
 heavy rainfall
 high
high
 moderate
 low
low
 almost none
San Pedro de Macorís vs World: Rainfall Compared
San Pedro de Macorís's average annual precipitation is 918 mm (36 in). Let's compare this to some popular worldwide tourist destinations:
Athens, Greece, receives an average annual precipitation of 400 mm (16 in), making it one of the drier Mediterranean climates with rainfall mostly in winter.
In Shanghai, China, the annual average precipitation is 1347 mm (53 in), with a humid subtropical climate.
In Brisbane, Australia, the annual precipitation is 979 mm (39 in), making it wetter than Sydney.
Kuala Lumpur, Malaysia, receives 2529 mm (100 in) of annual rainfall, characteristic of its equatorial tropical rainforest climate, with consistent rainfall throughout the year and peak months during March and November.
Precipitation amounts are measured using specific gauges installed at weather stations, collecting both rain and snow and any other type of precipitation. Rainfall is measured directly in millimeters, while that from snow and ice is obtained by melting it. Automated systems often incorporate heaters to make this easier.
Information from these stations is transmitted via Wi-Fi, satellite, GPS, or telephone connections to central monitoring networks. This information is immediately updated and integrated into weather models and forecasts.
- Mawsynram in India is noted as being the wettest place on earth, with over 11 meters (36 feet) of rain falling every year.
- In contrast, Antofagasta in Chile is among the driest places on the planet, getting less than 0.1mm (0.004 inches) per year, with some years recording virtually no rainfall.
- Nearly 1,650 thunderstorm cells are estimated over the planet at any given time.
For more detailed information about San Pedro de Macorís's weather, including sunshine hours, humidity levels, and temperature data, visit our San Pedro de Macorís Climate page.