















 The 10 most alternative cities in South America
Discover South America's top 10 alternative cities! From Valparaíso's vibrant streets to La Paz's high-altitude charm and Medellín's innovative spirit.
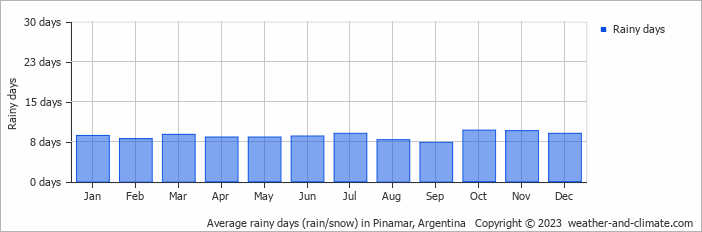
This page shows both the average monthly rainfall and the number of rainy days in Pinamar, Buenos Aires Province, Argentina. These values are calculated using 30 years of data (1990–2020) to ensure accuracy. Now, let's break down all the details for a clearer picture.
Generally, Pinamar experiences moderate precipitation patterns, averaging 926 mm (36 in) yearly.
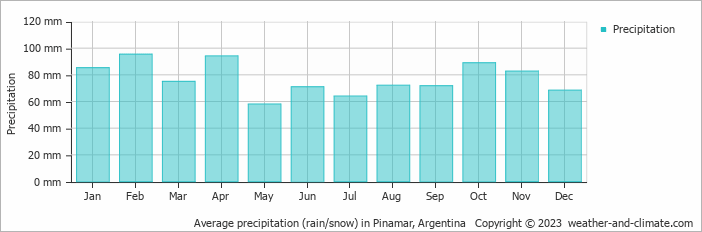
Pinamar offers a pleasant mix of wetter and slightly drier months. The difference in precipitation between February (95 mm (3.7 in)) and May (58 mm (2.3 in)) is not too significant, making the climate enjoyable for visitors and residents alike.
February, the wettest month, has a maximum daytime temperature of 25°C (77°F). During the driest month May you can expect a temperature of 17°C (63°F). For more detailed insights into the city's temperatures, visit our Pinamar Temperature page.
Browse day-by-day precipitation records for Pinamar spanning 51 years. Select any month and year to see actual rainfall and snowfall recorded on each day.
The map below shows the annual precipitation across Argentina. You can also select the different months in case you are interested in a specific month.
Pinamar's average annual precipitation is 926 mm (36 in). Let's compare this to some popular worldwide tourist destinations:
Athens, Greece, receives an average annual precipitation of 400 mm (16 in), making it one of the drier Mediterranean climates with rainfall mostly in winter.
Beijing, China, receives 560 mm (22 in) of annual precipitation, concentrated in the summer months.
Perth, Australia, receives 565 mm (22 in) of rainfall annually, mostly during the winter months.
Kuala Lumpur, Malaysia, receives 2529 mm (100 in) of annual rainfall, characteristic of its equatorial tropical rainforest climate, with consistent rainfall throughout the year and peak months during March and November.
Precipitation amounts are measured using specific gauges installed at weather stations, collecting both rain and snow and any other type of precipitation. Rainfall is measured directly in millimeters, while that from snow and ice is obtained by melting it. Automated systems often incorporate heaters to make this easier.
Information from these stations is transmitted via Wi-Fi, satellite, GPS, or telephone connections to central monitoring networks. This information is immediately updated and integrated into weather models and forecasts.
Precipitation has a very strong role in determining the local climate and ecosystem:
For more detailed information about Pinamar's weather, including sunshine hours, humidity levels, and temperature data, visit our Pinamar Climate page.
Pick a month to see the average temperature, rainfall and sunshine in Pinamar - and find the best time to visit.
Temperature Rainfall Humidity
See the full Pinamar climate overview or explore weather in Argentina.
Where to go in September - average daytime high across popular destinations.
Córdoba 23°C (73°F) Salta21°C (70°F) Mendoza20°C (68°F) Buenos Aires
 20°C (68°F) Mar del Plata16°C (61°F) San Martín de los Andes
 8°C (46°F) San Carlos de Bariloche8°C (46°F)
 Need travel inspiration? Check out our bucket list articles and be inspired.
The 10 most alternative cities in South America
Discover South America's top 10 alternative cities! From Valparaíso's vibrant streets to La Paz's high-altitude charm and Medellín's innovative spirit.
 Be amazed by Buenos Aires
The city of beautiful museums, cute streets, green parks, lots of good food, interesting local neighborhoods and impressive historical buildings.
 Argentina in November: Where to Go for the Best Weather
Compare November weather in Mendoza, Buenos Aires, Cafayate, Bariloche and Ushuaia to find Argentina's warmest, sunniest and driest places.
 Explore Patagonia
A tour through Patagonia brings you to the end of the world. That’s why Patagonia is a bucket list destination for many. We recommend to visit Patagonia from November to early March.