Paraty Monthly Rainfall & Precipitation
This page shows both the average monthly rainfall and the number of rainy days in Paraty, Rio de Janeiro State, Brazil. The numbers reflect climate data gathered over a 30-year period, from 1990 to 2020. Now, let's break down all the details for a clearer picture.
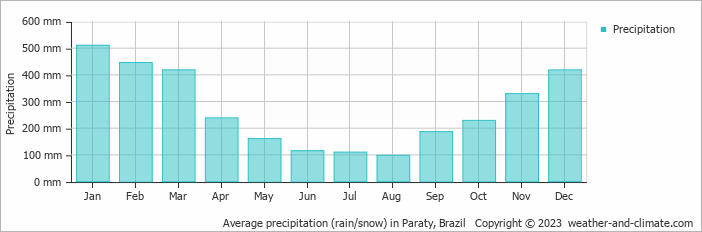
Paraty is known for its substantial rainfall, with annual precipitation reaching 3256 mm (128 in). While the overall climate is wet, there are notable seasonal patterns that create interesting contrasts, as demonstrated in our graph below.
Monthly Rainfall & Rainy Days
Monthly Precipitation Levels
The average number of days each month with precipitation (> 0.2 mm (0.01 in))
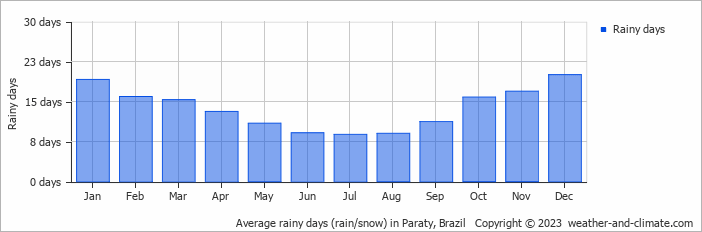
The climate in Paraty shows significant variation throughout the year. Expect 510 mm (20 in) of precipitation during the wettest month January, distributed over 19 rainy days.
In contrast, August offers drier and sunnier days, with around 98 mm (3.9 in) of rainfall over 9 rainy days.
January, the wettest month, has a maximum daytime temperature of 28°C (82°F). The city receives 104 hours of sunshine in this period. During the driest month August you can expect a temperature of 23°C (73°F). For more detailed insights into the city's temperatures, visit our Paraty Temperature page.
Explore Paraty's Historical Precipitation: 1977-2026
Browse day-by-day precipitation records for Paraty spanning 50 years. Select any month and year to see actual rainfall and snowfall recorded on each day.
Annual Rainfall in Brazil: City Comparison
The map below shows the annual precipitation across Brazil. You can also select the different months in case you are interested in a specific month.
Paraty vs World: Rainfall Compared
Paraty's average annual precipitation is 3256 mm (128 in). Let's compare this to some popular worldwide tourist destinations:
The climate in San Francisco, USA, is influenced by coastal weather, with 469 mm (18 in) of rainfall mostly during the winter months.
Meanwhile, Buenos Aires, Argentina, enjoys a humid subtropical climate with 1000 mm (39 in) of annual rainfall, mostly in the summer.
Perth, Australia, receives 565 mm (22 in) of rainfall annually, mostly during the winter months.
Ho Chi Minh City, Vietnam, receives 1955 mm (77 in) of annual rainfall, with a pronounced wet season from May to November, typical of its tropical monsoon climate.
Precipitation amounts are measured using specific gauges installed at weather stations, collecting both rain and snow and any other type of precipitation. Rainfall is measured directly in millimeters, while that from snow and ice is obtained by melting it. Automated systems often incorporate heaters to make this easier.
Information from these stations is transmitted via Wi-Fi, satellite, GPS, or telephone connections to central monitoring networks. This information is immediately updated and integrated into weather models and forecasts.
Tropical Rainforests: In tropical regions, rainfall is generally abundant year-round. Areas near the equator, like the Amazon rainforest, can receive up to 3000 mm (118 in) of rain annually.
Desert Regions: Deserts such as the Sahara and Arabian deserts typically see less than 250 mm (9.8 in) of rainfall annually. Rainfall tends to be infrequent, but when it does occur, it is often intense.
Temperate Zones: In temperate regions, precipitation tends to be more evenly distributed, though areas closer to the ocean may see more rain in the winter months, and areas further inland experience drier summers.
Polar Regions: Precipitation in polar regions, like Antarctica, is extremely low, often falling as snow. Average annual precipitation in Antarctica is less than 200 mm (7.9 in), with some areas receiving as little as 50 mm (2 in) annually.
- The U.S. has a significant number of thunderstorms every year, with over 14.6 million taking place across the world annually.
- Approximately 70% of lightning bolts strike land rather than oceans.
- A storm named John was the longest-lasting Pacific tropical storm, continuing for 31 days. As it crossed the dateline twice, it changed status from a hurricane to a typhoon and back to a hurricane.
For more detailed information about Paraty's weather, including sunshine hours, humidity levels, and temperature data, visit our Paraty Climate page.
Paraty Weather by Month
Pick a month to see the average temperature, rainfall and sunshine in Paraty - and find the best time to visit.
Paraty 3-Day Forecast
Temperature Rainfall Sunshine
See the full Paraty climate overview or explore weather in Brazil.
Popular this month
Where to go in August - average daytime high across popular destinations.
Bucket list
Need travel inspiration? Check out our bucket list articles and be inspired.
 The 10 most alternative cities in South America
Discover South America's top 10 alternative cities! From Valparaíso's vibrant streets to La Paz's high-altitude charm and Medellín's innovative spirit.
 The 5 most tranquil retreats in the Amazon Rainforest, Brazil
Discover top sustainable lodges in the Amazon. Enjoy unique wildlife, eco-friendly stays, and immersive experiences at Anavilhanas, Cristalino, and more.
An alternative way to discover Rio de Janeiro
Don't feel like seeing the traditional tourist sights in Rio de Janeiro? We have made an overview of the sights in Rio de Janeiro that you must see if you want to visit Rio in an alternative way.
Iguazu Falls
Iguazu Falls are among the largest waterfalls on earth. You will be speechless when you see this miracle of mother nature. They are included in the World Heritage List and have also been named one of the seven wonders of the world.