



















 An alternative way to discover Sydney
We have made an overview of the sights in Sydney that you must see if you want to visit Sydney in an alternative way.
This page shows both the average monthly rainfall and the number of rainy days in Noarlunga, South Australia, Australia. This average is based on long-term data collected between 1990 and 2020. Let's explore the details to provide you with a complete overview.
Generally, Noarlunga has a moderate amount of precipitation, averaging 580 mm (23 in) of rainfall annually. However, it does experience a distinct dry season during certain months. Take a look at our detailed charts below to see the seasonal variation.
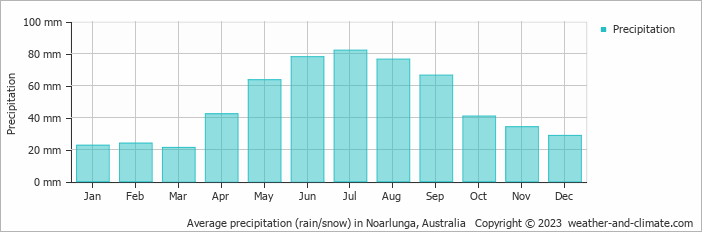
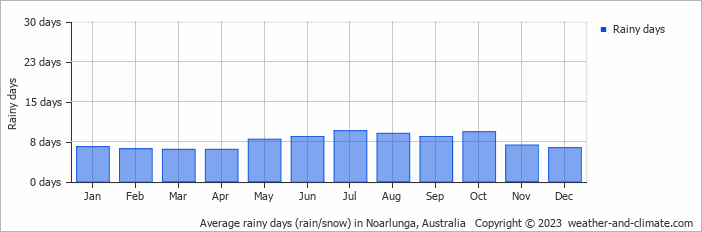
Significant seasonal changes in precipitation occur throughout the year. During the wettest month, July receives substantial rainfall, averaging 82 mm (3.2 in) of precipitation, recorded across 10 rainy days.
In contrast, the driest month, March brings less rainfall, with 21 mm (0.8 in) over 6 rainy days.
July, the wettest month, has a maximum daytime temperature of 14°C (57°F). The city receives 148 hours of sunshine in this period. During the driest month March you can expect a temperature of 24°C (75°F). For more detailed insights into the city's temperatures, visit our Noarlunga Temperature page.
The map below shows the annual precipitation across Australia. You can also select the different months in case you are interested in a specific month.
Noarlunga's average annual precipitation is 580 mm (23 in). Let's compare this to some popular worldwide tourist destinations:
In Barcelona, Spain, the average annual precipitation is 644 mm (25 in), evenly distributed across the year with no extreme wet or dry seasons.
In Shanghai, China, the annual average precipitation is 1347 mm (53 in), with a humid subtropical climate.
In Brisbane, Australia, the annual precipitation is 979 mm (39 in), making it wetter than Sydney.
Ho Chi Minh City, Vietnam, receives 1955 mm (77 in) of annual rainfall, with a pronounced wet season from May to November, typical of its tropical monsoon climate.
Precipitation amounts are measured using specific gauges installed at weather stations, collecting both rain and snow and any other type of precipitation. Rainfall is measured directly in millimeters, while that from snow and ice is obtained by melting it. Automated systems often incorporate heaters to make this easier.
Information from these stations is transmitted via Wi-Fi, satellite, GPS, or telephone connections to central monitoring networks. This information is immediately updated and integrated into weather models and forecasts.
Precipitation has a very strong role in determining the local climate and ecosystem:
For more detailed information about Noarlunga's weather, including sunshine hours, humidity levels, and temperature data, visit our Noarlunga Climate page.
Pick a month to see the average temperature, rainfall and sunshine in Noarlunga - and find the best time to visit.
Temperature Rainfall Sunshine Humidity
See the full Noarlunga climate overview or explore weather in Australia.
Where to go in September - average daytime high across popular destinations.
Need travel inspiration? Check out our bucket list articles and be inspired.
An alternative way to discover Sydney
We have made an overview of the sights in Sydney that you must see if you want to visit Sydney in an alternative way.
 The most relaxed and alternative area of Australia is called the Byron Shire
The Byron Shire is one of the most pretty areas in the world. Not only in terms on natural beauty, also the relaxed vibe and people make this an area that remains close to your heart.
 Sail the Whitsunday islands
The best travel period to sail the Whitsunday islands is “winter” between June and October, with pleasant temperatures around 23 degrees Celsius (74 Fahrenheit).
 The best dive spots in Australia
Explore Australia's best dive spots: from the Great Barrier Reef to HMAS Perth. Discover vibrant corals, marine life, and historic wrecks.