

















 Discover Kok Kood: a hidden gem in Thailand
Discover the hidden gem of Thailand - Koh Kood! Explore stunning beaches, waterfalls and eco-friendly resorts while enjoying a peaceful atmosphere away from the crowds.
This page shows both the average monthly rainfall and the number of rainy days in Nan, Nan Province, Thailand. Long-term data from 1990 to 2020 was used to calculate these averages. Now, let's break down all the details for a clearer picture.
Nan is known for its substantial rainfall, with annual precipitation reaching 1618 mm (64 in). While the overall climate is wet, there are notable seasonal patterns that create interesting contrasts, as demonstrated in our graph below.
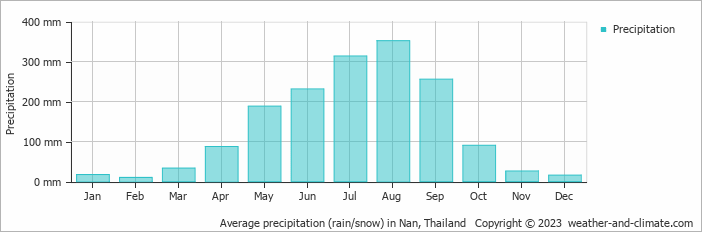
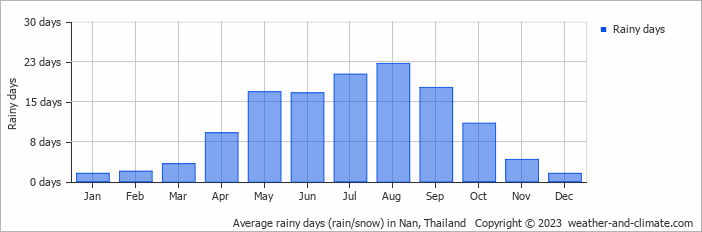
Nan can be quite wet during August, receiving approximately 352 mm (14 in) of precipitation over 22 rainy days.
In contrast February, experiences much drier conditions, with 9.8 mm (0.4 in) of rainfall, spread across 2 rainy days.
August, the wettest month, has a maximum daytime temperature of 32°C (90°F). During the driest month February you can expect a temperature of 34°C (93°F). For more detailed insights into the city's temperatures, visit our Nan Temperature page.
The map below shows the annual precipitation across Thailand. You can also select the different months in case you are interested in a specific month.
Nan's average annual precipitation is 1618 mm (64 in). Let's compare this to some popular worldwide tourist destinations:
In Barcelona, Spain, the average annual precipitation is 644 mm (25 in), evenly distributed across the year with no extreme wet or dry seasons.
Meanwhile, Buenos Aires, Argentina, enjoys a humid subtropical climate with 1000 mm (39 in) of annual rainfall, mostly in the summer.
Adelaide, Australia, enjoys 511 mm (20 in) of annual precipitation, with dry summers and wet winters.
Mumbai, India, experiences a tropical monsoon climate with 1860 mm (73 in) of annual rainfall, with the majority of precipitation happening during the monsoon season from June to September.
Precipitation amounts are measured using specific gauges installed at weather stations, collecting both rain and snow and any other type of precipitation. Rainfall is measured directly in millimeters, while that from snow and ice is obtained by melting it. Automated systems often incorporate heaters to make this easier.
Information from these stations is transmitted via Wi-Fi, satellite, GPS, or telephone connections to central monitoring networks. This information is immediately updated and integrated into weather models and forecasts.
For more detailed information about Nan's weather, including sunshine hours, humidity levels, and temperature data, visit our Nan Climate page.
Pick a month to see the average temperature, rainfall and sunshine in Nan - and find the best time to visit.
Temperature Rainfall
See the full Nan climate overview or explore weather in Thailand.
Where to go in September - average daytime high across popular destinations.
Bangkok 34°C (93°F) Chiang Mai33°C (91°F) Jomtien Beach32°C (90°F) Hua Hin32°C (90°F) Ao Nang Beach30°C (86°F) Koh Samui30°C (86°F) Ko Lanta30°C (86°F) Patong Beach29°C (84°F)
 Need travel inspiration? Check out our bucket list articles and be inspired.
Discover Kok Kood: a hidden gem in Thailand
Discover the hidden gem of Thailand - Koh Kood! Explore stunning beaches, waterfalls and eco-friendly resorts while enjoying a peaceful atmosphere away from the crowds.

 Where to Travel in July and August: Mexico, Thailand, Indonesia or Somewhere Else?
Compare July and August weather in Mexico, Thailand, Indonesia, Zanzibar and Sri Lanka, using historical climate data for temperature, rainfall and sunshine.
 Discover Thailand: An Ultimate Guide for Yogis
Explore Thailand's best for yogis: serene retreats, spiritual growth, and adventure. Dive into yoga, meditation, and nature's tranquility for an unforgettable journey.
 Trekking in Northern Thailand
One of the most beautiful attractions in Thailand is trekking along mountain villages north of Chiang Mai. The best time to trek is November until February.