Ao Nang Beach Monthly Rainfall & Precipitation
This page shows both the average monthly rainfall and the number of rainy days in Ao Nang Beach, Krabi Province, Thailand. These averages rely on historical data collected over 30 years, from 1990 to 2020. Let's explore the details to provide you with a complete overview.
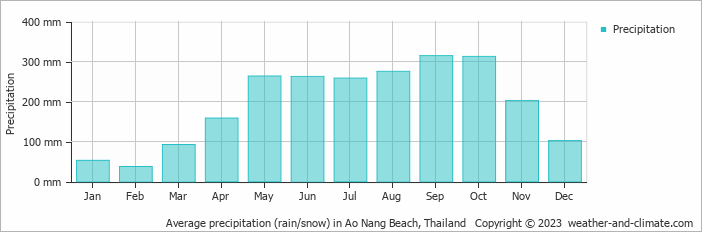
Ao Nang Beach has a relatively rainy climate with high precipitation levels, averaging 2328 mm (92 in) of rainfall annually. Despite the high annual total, it does experience a distinct rainy season during certain months. Examine our detailed charts below to understand these seasonal patterns.
Monthly Precipitation Levels
The average number of days each month with precipitation (> 0.2 mm (0.01 in))
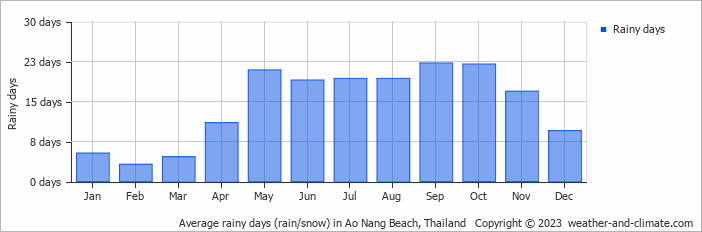
The seasons in Ao Nang Beach, bring significant changes in precipitation. The wettest month, September, receives heavy rainfall, with an average of 314 mm (12 in) of precipitation. This rainfall is distributed across 22 rainy days.
In contrast, the driest month, February, experiences much less rainfall, totaling 37 mm (1.5 in) over 3 rainy days. These distinct seasonal differences provide diverse experiences throughout the year.September, the wettest month, has a maximum daytime temperature of 30°C (86°F). The city receives 145 hours of sunshine in this period. During the driest month February you can expect a temperature of 32°C (90°F). For more detailed insights into the city's temperatures, visit our Ao Nang Beach Temperature page.
Daily Historical Precipitation
50-year average (1976-2025)
Average daily rainfall for each day of the month based on long-term records.
Average precipitation in July
Explore Ao Nang Beach's Historical Precipitation: 1976-2026
Browse day-by-day precipitation records for Ao Nang Beach spanning 51 years. Select any month and year to see actual rainfall and snowfall recorded on each day.
Annual Rainfall in Thailand: City Comparison
The map below shows the annual precipitation across Thailand. You can also select the different months in case you are interested in a specific month.
 heavy rainfall
 high
high
 moderate
 low
low
 almost none
Ao Nang Beach vs World: Rainfall Compared
Ao Nang Beach's average annual precipitation is 2328 mm (92 in). Let's compare this to some popular worldwide tourist destinations:
Seville, Spain, experiences 541 mm (21 in) of rainfall annually, with wet winters and dry summers typical of southern Spain.
Meanwhile, Buenos Aires, Argentina, enjoys a humid subtropical climate with 1000 mm (39 in) of annual rainfall, mostly in the summer.
In Tokyo, Japan, the average annual precipitation is 1528 mm (60 in), with significant summer rains due to typhoon season.
Bangkok, Thailand, experiences a tropical monsoon climate with 1668 mm (66 in) of annual rainfall, with the heaviest precipitation occurring during September and October.
Precipitation amounts are measured using specific gauges installed at weather stations, collecting both rain and snow and any other type of precipitation. Rainfall is measured directly in millimeters, while that from snow and ice is obtained by melting it. Automated systems often incorporate heaters to make this easier.
Information from these stations is transmitted via Wi-Fi, satellite, GPS, or telephone connections to central monitoring networks. This information is immediately updated and integrated into weather models and forecasts.
The proximity of a location to a large body of water can significantly affect its rainfall patterns:
- Ocean Influence: Coastal regions typically receive more rainfall due to the presence of moisture-laden winds from the ocean. These regions tend to have more humid climates and experience more frequent precipitation, especially in winter.
- Continental Climates: Areas further from the sea, such as inland or continental regions, experience less frequent rainfall and more extreme seasonal variations in precipitation.
- "Ginger" was the longest-lasting Atlantic tropical storm, which spun around the open ocean for 28 days in 1971.
- The world's largest snowflake was recorded in the Guinness Book of Records, at 38 cm (15 inches) wide and 20 cm (7.9 inches) thick. The snowflake fell at Fort Keogh, Montana, USA, on 28 January 1887.
- The greatest snowfall recorded was on Mt. Rainier, Washington State, USA—over 31.5 meters (103 feet) fell during the winter of 1972.
For more detailed information about Ao Nang Beach's weather, including sunshine hours, humidity levels, and temperature data, visit our Ao Nang Beach Climate page.


