Murska Sobota Monthly Rainfall & Precipitation
This page shows both the average monthly rainfall and the number of rainy days in Murska Sobota, Pomurje, Slovenia. These averages rely on historical data collected over 30 years, from 1990 to 2020. Let's now guide you through the details for a complete overview.
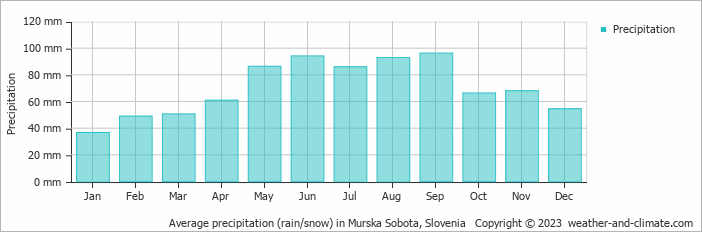
Generally, Murska Sobota experiences moderate precipitation patterns, averaging 841 mm (33 in) yearly.
Monthly Rainfall & Rainy Days
Monthly Precipitation Levels
The average number of days each month with precipitation (> 0.2 mm (0.01 in))
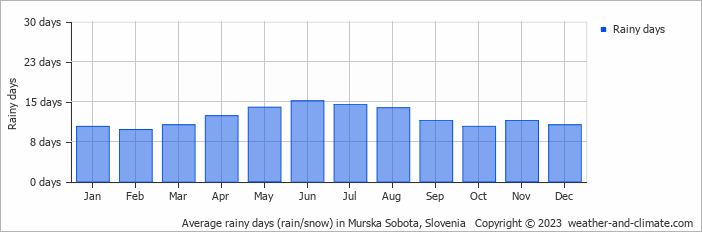
Murska Sobota can be quite wet during September, receiving approximately 96 mm (3.8 in) of precipitation over 11 rainy days.
In contrast January, experiences much drier conditions, with 37 mm (1.5 in) of snow/rainfall, spread across 10 snowy/rainy days.
September, the wettest month, has a maximum daytime temperature of 22°C (72°F). The city receives 172 hours of sunshine in this period. During the driest month January you can expect a temperature of 5°C (41°F). For more detailed insights into the city's temperatures, visit our Murska Sobota Temperature page.
Annual Rainfall in Slovenia: City Comparison
The map below shows the annual precipitation across Slovenia. You can also select the different months in case you are interested in a specific month.
Murska Sobota vs World: Rainfall Compared
Murska Sobota's average annual precipitation is 841 mm (33 in). Let's compare this to some popular worldwide tourist destinations:
Seville, Spain, experiences 541 mm (21 in) of rainfall annually, with wet winters and dry summers typical of southern Spain.
In Seoul, South Korea, the average annual precipitation is 1237 mm (49 in), with most rain falling during the summer monsoon season.
Adelaide, Australia, enjoys 511 mm (20 in) of annual precipitation, with dry summers and wet winters.
Singapore, situated near the equator, gets 2581 mm (102 in) of rainfall annually, with no distinct dry season and consistent monthly precipitation.
Precipitation amounts are measured using specific gauges installed at weather stations, collecting both rain and snow and any other type of precipitation. Rainfall is measured directly in millimeters, while that from snow and ice is obtained by melting it. Automated systems often incorporate heaters to make this easier.
Information from these stations is transmitted via Wi-Fi, satellite, GPS, or telephone connections to central monitoring networks. This information is immediately updated and integrated into weather models and forecasts.
- The U.S. has a significant number of thunderstorms every year, with over 14.6 million taking place across the world annually.
- Approximately 70% of lightning bolts strike land rather than oceans.
- A storm named John was the longest-lasting Pacific tropical storm, continuing for 31 days. As it crossed the dateline twice, it changed status from a hurricane to a typhoon and back to a hurricane.
For more detailed information about Murska Sobota's weather, including sunshine hours, humidity levels, and temperature data, visit our Murska Sobota Climate page.
Murska Sobota Weather by Month
Pick a month to see the average temperature, rainfall and sunshine in Murska Sobota - and find the best time to visit.



Murska Sobota 3-Day Forecast
Temperature Rainfall Sunshine Humidity
See the full Murska Sobota climate overview or explore weather in Slovenia.
Popular this month
Where to go in September - average daytime high across popular destinations.
 Piran
Piran 24°C (75°F) Portorož24°C (75°F) Maribor
 21°C (70°F) Ljubljana21°C (70°F) Bled19°C (66°F) Bovec19°C (66°F) Bohinj19°C (66°F) Kranjska Gora18°C (64°F)















Bucket list
Need travel inspiration? Check out our bucket list articles and be inspired.
Go to Bovec in Slovenia
With mountains that linger in the blue sky, an emerald-green river Bovec offers picturesque scenes that are a must see for your bucket list.
Experience Dazzling Fairy Tales In The Lake Bled Of Slovenia
Slovenia's most well-known tourist destination is Lake Bled, which is still relatively undiscovered when compared to other European attractions despite its growing notoriety.