Maynooth Monthly Rainfall & Precipitation
This page shows both the average monthly rainfall and the number of rainy days in Maynooth, Kildare County, Ireland. Long-term data from 1990 to 2020 was used to calculate these averages. Let's explore the details to provide you with a complete overview.
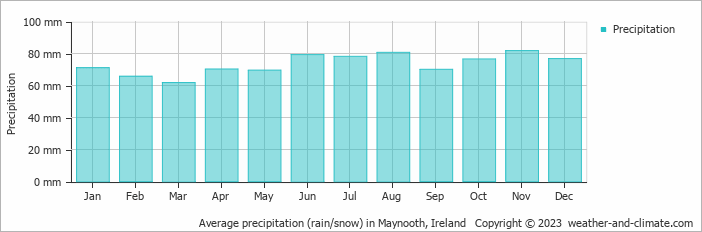
Generally, Maynooth receives mid-range precipitation levels, with 881 mm (35 in) annually.
Monthly Rainfall & Rainy Days
Monthly Precipitation Levels
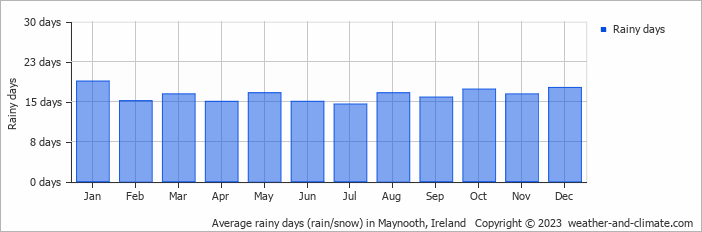
The average number of days each month with precipitation (> 0.2 mm (0.01 in))
The wettest period in Maynooth occurs in November, which receives around 82 mm (3.2 in) of precipitation. During the driest month, March, Maynooth experiences moderate rainfall, totaling approximately 62 mm (2.4 in). The consistent precipitation levels throughout the year contribute to a relatively stable climate.
November, the wettest month, has a maximum daytime temperature of 11°C (52°F). The city receives 71 hours of sunshine in this period. During the driest month March you can expect a temperature of 11°C (52°F). For more detailed insights into the city's temperatures, visit our Maynooth Temperature page.
Annual Rainfall in Ireland: City Comparison
The map below shows the annual precipitation across Ireland. You can also select the different months in case you are interested in a specific month.
Maynooth vs World: Rainfall Compared
Maynooth's average annual precipitation is 881 mm (35 in). Let's compare this to some popular worldwide tourist destinations:
In Lisbon, Portugal, the average annual precipitation is 774 mm (30 in), characterized by wet winters and dry summers typical of the Mediterranean climate.
Beijing, China, receives 560 mm (22 in) of annual precipitation, concentrated in the summer months.
Melbourne, Australia, has 690 mm (27 in) of rainfall annually, spread fairly evenly throughout the year.
Ho Chi Minh City, Vietnam, receives 1955 mm (77 in) of annual rainfall, with a pronounced wet season from May to November, typical of its tropical monsoon climate.
Precipitation amounts are measured using specific gauges installed at weather stations, collecting both rain and snow and any other type of precipitation. Rainfall is measured directly in millimeters, while that from snow and ice is obtained by melting it. Automated systems often incorporate heaters to make this easier.
Information from these stations is transmitted via Wi-Fi, satellite, GPS, or telephone connections to central monitoring networks. This information is immediately updated and integrated into weather models and forecasts.
Climate change is affecting precipitation patterns worldwide, including Maynooth:
- Changing Rainfall Patterns: Global warming causes drastic changes in the patterns of rainfall. Some areas have been experiencing increased frequency and intensity of rainfall, while other areas experience longer dry spells or even droughts.
- Local Impacts: Many regions are experiencing heavier rainfall in the winter months and drier, hotter summers. This affects agriculture, water resources, and ecosystems.
- The U.S. has a significant number of thunderstorms every year, with over 14.6 million taking place across the world annually.
- Approximately 70% of lightning bolts strike land rather than oceans.
- A storm named John was the longest-lasting Pacific tropical storm, continuing for 31 days. As it crossed the dateline twice, it changed status from a hurricane to a typhoon and back to a hurricane.
For more detailed information about Maynooth's weather, including sunshine hours, humidity levels, and temperature data, visit our Maynooth Climate page.
Maynooth Weather by Month
Pick a month to see the average temperature, rainfall and sunshine in Maynooth - and find the best time to visit.
Maynooth 3-Day Forecast
Temperature Rainfall Sunshine Humidity Wind Speed Water Temp
See the full Maynooth climate overview or explore weather in Ireland.
Popular this month
Where to go in August - average daytime high across popular destinations.
Bucket list
Need travel inspiration? Check out our bucket list articles and be inspired.
 Go to Dingle in Ireland
Dolphins, Whales and breathtaking views. The colorful fishing village Dingle in Ireland has it all and this town is a must for your bucket list.
An Irish adventure like no other in Killarney National Park
Head down to the South West part of the country, County Kerry, to the small town of Killarney. If you want to experience what Ireland is really all about
Horseback riding in Ireland
Ireland is the most ideal place in the world for horseback riding. Combine this with the most hospitable people you will ever encounter and you have an unforgettable dream trip to add to your bucket list.