Mai Khao Beach Monthly Rainfall & Precipitation
This page shows both the average monthly rainfall and the number of rainy days in Mai Khao Beach, Phuket Province, Thailand. The figures are based on a 30-year period (1990–2020) to provide a reliable average. Let's now guide you through the details for a complete overview.
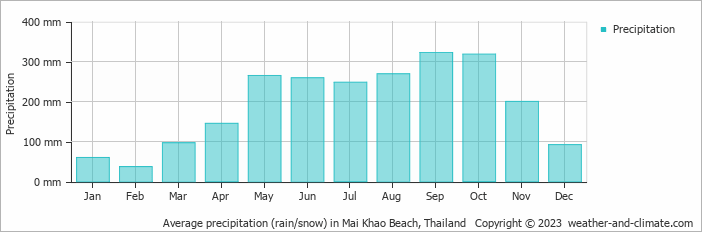
Mai Khao Beach is known for its substantial rainfall, with annual precipitation reaching 2309 mm (91 in). While the overall climate is wet, there are notable seasonal patterns that create interesting contrasts, as demonstrated in our graph below.
Monthly Precipitation Levels
The average number of days each month with precipitation (> 0.2 mm (0.01 in))
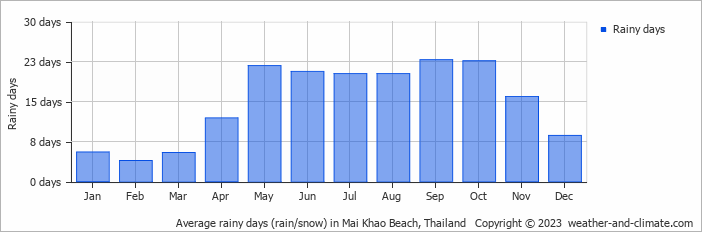
The climate in Mai Khao Beach shows significant variation throughout the year. Expect 322 mm (13 in) of precipitation during the wettest month September, distributed over 23 rainy days.
In contrast, February offers drier and sunnier days, with around 37 mm (1.5 in) of rainfall over 4 rainy days.
September, the wettest month, has a maximum daytime temperature of 29°C (84°F). The city receives 100 hours of sunshine in this period. During the driest month February you can expect a temperature of 31°C (88°F). For more detailed insights into the city's temperatures, visit our Mai Khao Beach Temperature page.
Annual Rainfall in Thailand: City Comparison
The map below shows the annual precipitation across Thailand. You can also select the different months in case you are interested in a specific month.
 heavy rainfall
 high
high
 moderate
 low
low
 almost none
Mai Khao Beach vs World: Rainfall Compared
Mai Khao Beach's average annual precipitation is 2309 mm (91 in). Let's compare this to some popular worldwide tourist destinations:
The climate in San Francisco, USA, is influenced by coastal weather, with 469 mm (18 in) of rainfall mostly during the winter months.
Osaka, Japan, experiences 1507 mm (59 in) of rainfall annually, spread across the year with wetter summers.
In Brisbane, Australia, the annual precipitation is 979 mm (39 in), making it wetter than Sydney.
Bangkok, Thailand, experiences a tropical monsoon climate with 1668 mm (66 in) of annual rainfall, with the heaviest precipitation occurring during September and October.
Precipitation amounts are measured using specific gauges installed at weather stations, collecting both rain and snow and any other type of precipitation. Rainfall is measured directly in millimeters, while that from snow and ice is obtained by melting it. Automated systems often incorporate heaters to make this easier.
Information from these stations is transmitted via Wi-Fi, satellite, GPS, or telephone connections to central monitoring networks. This information is immediately updated and integrated into weather models and forecasts.
- "Ginger" was the longest-lasting Atlantic tropical storm, which spun around the open ocean for 28 days in 1971.
- The world's largest snowflake was recorded in the Guinness Book of Records, at 38 cm (15 inches) wide and 20 cm (7.9 inches) thick. The snowflake fell at Fort Keogh, Montana, USA, on 28 January 1887.
- The greatest snowfall recorded was on Mt. Rainier, Washington State, USA—over 31.5 meters (103 feet) fell during the winter of 1972.
For more detailed information about Mai Khao Beach's weather, including sunshine hours, humidity levels, and temperature data, visit our Mai Khao Beach Climate page.


