Khabarovsk Monthly Rainfall & Precipitation
This page shows both the average monthly rainfall and the number of rainy days in Khabarovsk, Khabarovsk Region, Russia. These values are calculated using 30 years of data (1990–2020) to ensure accuracy. Now, let's explore all the details to give you a full picture.
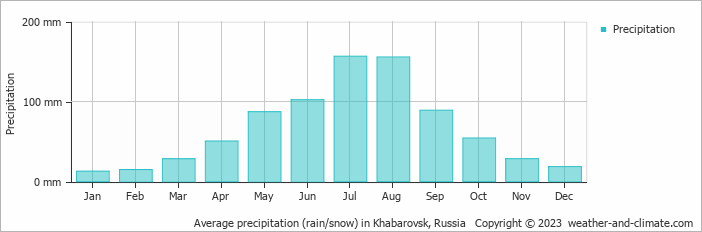
On average, Khabarovsk receives a reasonable amount of rain/snowfall, with an annual precipitation of 797 mm (31 in). Despite this overall moderate level, the city experiences distinct dry season during certain months throughout the year, as illustrated in the precipitation charts below.
Monthly Precipitation Levels
The average number of days each month with precipitation (> 0.2 mm (0.01 in))
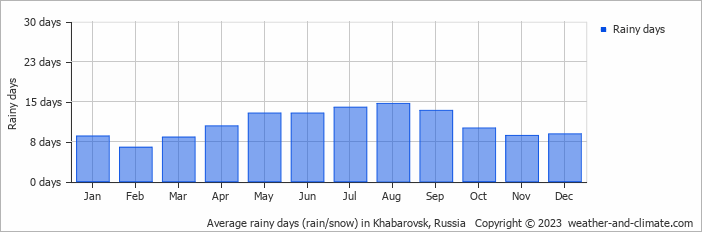
Khabarovsk can be quite wet during July, receiving approximately 156 mm (6.1 in) of precipitation over 14 rainy days.
In contrast January, experiences much drier conditions, with 13 mm (0.5 in) of snowfall, spread across 9 snowy days.
July, the wettest month, has a maximum daytime temperature of 28°C (82°F). The city receives 250 hours of sunshine in this period. During the driest month January you can expect a temperature of -14°C (7°F). For more detailed insights into the city's temperatures, visit our Khabarovsk Temperature page.
Daily Historical Precipitation
50-year average (1976-2025)
Average daily rainfall for each day of the month based on long-term records.
Average precipitation in July
Explore Khabarovsk's Historical Precipitation: 1976-2026
Browse day-by-day precipitation records for Khabarovsk spanning 51 years. Select any month and year to see actual rainfall and snowfall recorded on each day.
Annual Rainfall in Russia: City Comparison
The map below shows the annual precipitation across Russia. You can also select the different months in case you are interested in a specific month.
 heavy rainfall
 high
high
 moderate
 low
low
 almost none
Khabarovsk vs World: Rainfall Compared
Khabarovsk's average annual precipitation is 797 mm (31 in). Let's compare this to some popular worldwide tourist destinations:
Boston, USA, experiences 1238 mm (49 in) of annual precipitation, including significant snowfall during the winter.
Meanwhile, Buenos Aires, Argentina, enjoys a humid subtropical climate with 1000 mm (39 in) of annual rainfall, mostly in the summer.
In Tokyo, Japan, the average annual precipitation is 1528 mm (60 in), with significant summer rains due to typhoon season.
Ho Chi Minh City, Vietnam, receives 1955 mm (77 in) of annual rainfall, with a pronounced wet season from May to November, typical of its tropical monsoon climate.
Precipitation amounts are measured using specific gauges installed at weather stations, collecting both rain and snow and any other type of precipitation. Rainfall is measured directly in millimeters, while that from snow and ice is obtained by melting it. Automated systems often incorporate heaters to make this easier.
Information from these stations is transmitted via Wi-Fi, satellite, GPS, or telephone connections to central monitoring networks. This information is immediately updated and integrated into weather models and forecasts.
- The U.S. has a significant number of thunderstorms every year, with over 14.6 million taking place across the world annually.
- Approximately 70% of lightning bolts strike land rather than oceans.
- A storm named John was the longest-lasting Pacific tropical storm, continuing for 31 days. As it crossed the dateline twice, it changed status from a hurricane to a typhoon and back to a hurricane.
For more detailed information about Khabarovsk's weather, including sunshine hours, humidity levels, and temperature data, visit our Khabarovsk Climate page.