Khabarovsk Weather & Climate: Best Time to Visit
Average temperatures, rainfall, sunshine and the best time to visit Khabarovsk.
Climate overview of Khabarovsk
Khabarovsk, Khabarovsk Region, Russia, sees big temperature differences between seasons, with July peaking at 28°C (82°F) and January dropping to -14°C (7°F).
Annual rain/snowfall is moderate at around 797 mm (31 in), with July being the wettest month. The city also has a distinct dry season from November to March, with warm summers and very cold winters. The sunniest month is June, with 8.8 hours of sunshine per day on average.
Khabarovsk Weather by Month
Pick a month to see the average temperature, rainfall and sunshine in Khabarovsk - and find the best time to visit.
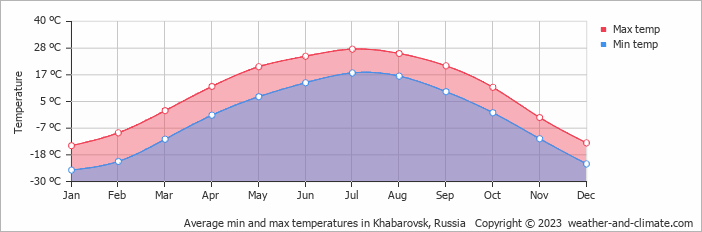
Monthly Temperature in Khabarovsk
Visitors to Khabarovsk can expect significant temperature changes throughout the year. Average daytime temperatures reach a comfortable 28°C (82°F) in July. In January, the coolest month of the year, temperatures drop to a very cold -14°C (7°F).
At night, temperatures range from around 18°C (64°F) in July to -25°C (-13°F) in January.
Check out our detailed temperature page for more information.
Temperature ranges by month
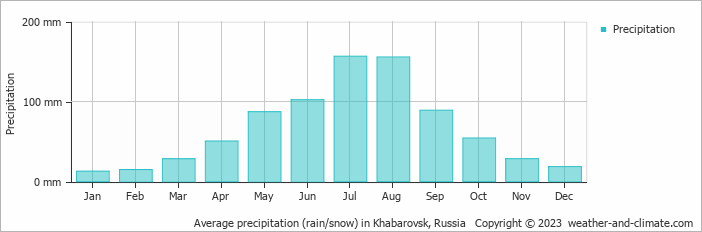
Rainfall in Khabarovsk
Generally, Khabarovsk experiences moderate precipitation patterns, averaging 797 mm (31 in) yearly. Khabarovsk can be quite wet during July, receiving approximately 156 mm (6.1 in) of precipitation over 14 rainy days.
In contrast, during the driest month (January), you will experience much drier conditions, with 13 mm (0.5 in) of precipitation spread across 9 snowy days. For more details, please visit our Khabarovsk Precipitation page.
The mean monthly precipitation over the year, including rain, hail, and snow
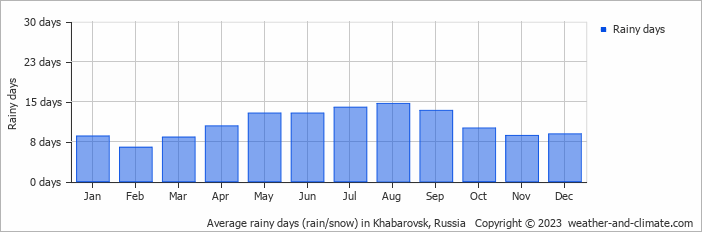
The average number of days each month with precipitation
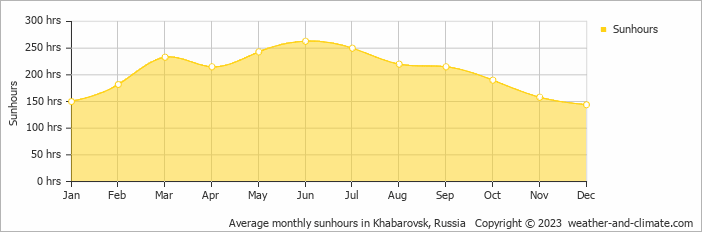
Sunshine Hours in Khabarovsk
Khabarovsk can be enjoyed more throughout the sunniest month of June under a blue sky, with approximately 8.8 hours of sunshine daily. In contrast, the city experiences much darker days in December, with only 4.8 hours of sunlight per day.
Visit our detailed sunshine hours page for more information.
Monthly hours of sunshine
Daily hours of sunshine
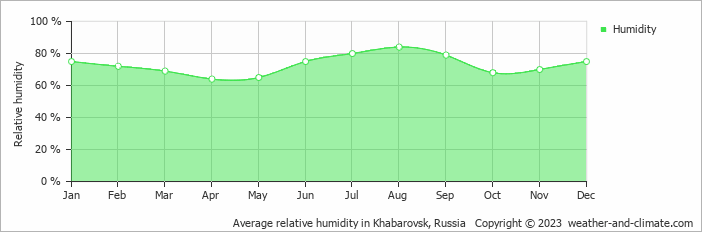
Humidity in Khabarovsk by Month
The relative humidity is high throughout the year in Khabarovsk.
The city experiences its highest humidity in August, reaching 84%. In April, the humidity drops to its lowest level at 64%. What does this mean? Read our detailed page on humidity levels for further details.
Relative humidity over the year
Best Time to Visit Khabarovsk
Monthly ratings reflect general weather comfort, based on daytime temperature and rainfall. Swimming and winter conditions are highlighted separately where relevant.
- Best overall: May and September
- Warmest weather: July
- Most sunshine: June and July
- Fewest rainy days: February and March
- Wettest months: May, June, July, August and September, when rainfall is highest.
- Seasonal pattern: A distinct dry season from November to March, with warm summers and very cold winters
- Coldest conditions: January, with freezing nights around -25°C (-13°F).
Frequently asked questions about the climate in Khabarovsk
What is the best time to visit Khabarovsk?
May and September typically offer the most optimal weather in Khabarovsk. In contrast, January, February, March, November and December tend to have less optimal conditions. Khabarovsk has a distinct dry season from November to March, with warm summers and very cold winters.
What temperatures can I expect in Khabarovsk?
Daytime highs range from -14°C (7°F) in January to 28°C (82°F) in July. Nighttime lows range from -25°C (-13°F) to 18°C (64°F). Temperatures vary considerably through the year.
How much rain does Khabarovsk get?
Annual rainfall is around 797 mm (31 in). July is the wettest month with 156 mm (6.1 in), while January is the driest with 13 mm (0.5 in).
How sunny is Khabarovsk?
Khabarovsk receives around 2,463 hours of sunshine per year. June is the sunniest month with 263 hours, while December is the cloudiest with just 144 hours. Overall, Khabarovsk enjoys abundant sunshine.
Khabarovsk 3-Day Forecast
Khabarovsk 3-Day Forecast
Khabarovsk on the map
Khabarovsk is highlighted - select any city to see its climate.
Popular this month
Where to go in July - average daytime high across popular destinations.
Bucket list
Need travel inspiration? Check out our bucket list articles and be inspired.
 Visit the Kamchatka Peninsula
One of the most enchanting areas of Russia is the Kamchatka peninsula. It is how the earth must have looked like in prehistoric times.
Be amazed by the Altai mountains
The Atlai mountains are a sparsely populated area that most tourists have not yet discovered. Definitely bucket list material for the adventurous travelers among us.