Kalamakia Monthly Rainfall & Precipitation
This page shows both the average monthly rainfall and the number of rainy days in Kalamakia, Alonissos, Greece. The figures are based on a 30-year period (1990–2020) to provide a reliable average. Now, let's explore all the details to give you a full picture.
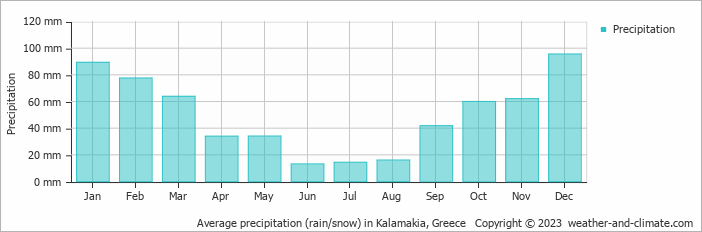
Generally, Kalamakia receives mid-range precipitation levels, with 601 mm (24 in) annually. The distribution varies significantly throughout the year, with a distinct dry season during certain months, as shown in our charts below.
Monthly Precipitation Levels
The average number of days each month with precipitation (> 0.2 mm (0.01 in))
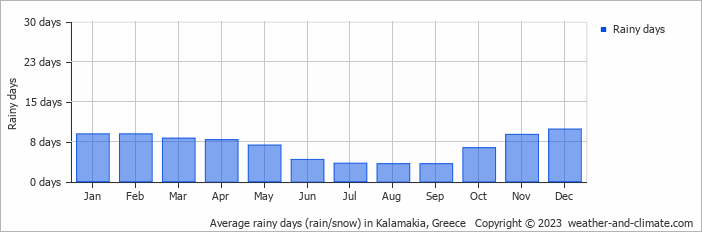
Kalamakia can be quite wet during December, receiving approximately 96 mm (3.8 in) of precipitation over 10 rainy days.
In contrast June, experiences much drier conditions, with 13 mm (0.5 in) of rainfall, spread across 4 rainy days.
December, the wettest month, has a maximum daytime temperature of 15°C (59°F). During the driest month June you can expect a temperature of 25°C (77°F). For more detailed insights into the city's temperatures, visit our Kalamakia Temperature page.
Annual Rainfall in Greece: City Comparison
The map below shows the annual precipitation across Greece. You can also select the different months in case you are interested in a specific month.
 heavy rainfall
 high
high
 moderate
 low
low
 almost none
Kalamakia vs World: Rainfall Compared
Kalamakia's average annual precipitation is 601 mm (24 in). Let's compare this to some popular worldwide tourist destinations:
In Barcelona, Spain, the average annual precipitation is 644 mm (25 in), evenly distributed across the year with no extreme wet or dry seasons.
Osaka, Japan, experiences 1507 mm (59 in) of rainfall annually, spread across the year with wetter summers.
Melbourne, Australia, has 690 mm (27 in) of rainfall annually, spread fairly evenly throughout the year.
Kuala Lumpur, Malaysia, receives 2529 mm (100 in) of annual rainfall, characteristic of its equatorial tropical rainforest climate, with consistent rainfall throughout the year and peak months during March and November.
Precipitation amounts are measured using specific gauges installed at weather stations, collecting both rain and snow and any other type of precipitation. Rainfall is measured directly in millimeters, while that from snow and ice is obtained by melting it. Automated systems often incorporate heaters to make this easier.
Information from these stations is transmitted via Wi-Fi, satellite, GPS, or telephone connections to central monitoring networks. This information is immediately updated and integrated into weather models and forecasts.
Tropical Rainforests: In tropical regions, rainfall is generally abundant year-round. Areas near the equator, like the Amazon rainforest, can receive up to 3000 mm (118 in) of rain annually.
Desert Regions: Deserts such as the Sahara and Arabian deserts typically see less than 250 mm (9.8 in) of rainfall annually. Rainfall tends to be infrequent, but when it does occur, it is often intense.
Temperate Zones: In temperate regions, precipitation tends to be more evenly distributed, though areas closer to the ocean may see more rain in the winter months, and areas further inland experience drier summers.
Polar Regions: Precipitation in polar regions, like Antarctica, is extremely low, often falling as snow. Average annual precipitation in Antarctica is less than 200 mm (7.9 in), with some areas receiving as little as 50 mm (2 in) annually.
- Mawsynram in India is noted as being the wettest place on earth, with over 11 meters (36 feet) of rain falling every year.
- In contrast, Antofagasta in Chile is among the driest places on the planet, getting less than 0.1mm (0.004 inches) per year, with some years recording virtually no rainfall.
- Nearly 1,650 thunderstorm cells are estimated over the planet at any given time.
For more detailed information about Kalamakia's weather, including sunshine hours, humidity levels, and temperature data, visit our Kalamakia Climate page.