Guarujá Monthly Rainfall & Precipitation
This page shows both the average monthly rainfall and the number of rainy days in Guarujá, São Paulo State, Brazil. This average is based on long-term data collected between 1990 and 2020. Let's now guide you through the details for a complete overview.
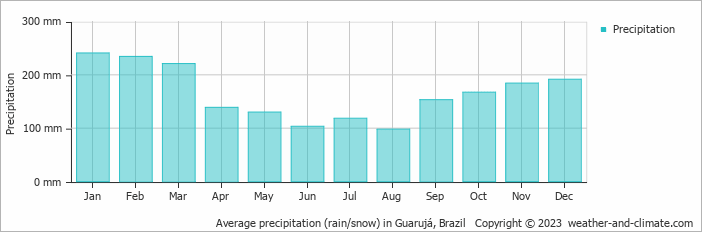
Guarujá has a relatively rainy climate with high precipitation levels, averaging 1980 mm (78 in) of rainfall annually. Despite the high annual total, it does experience a distinct rainy season during certain months. Examine our detailed charts below to understand these seasonal patterns.
Monthly Rainfall & Rainy Days
Monthly Precipitation Levels
The average number of days each month with precipitation (> 0.2 mm (0.01 in))
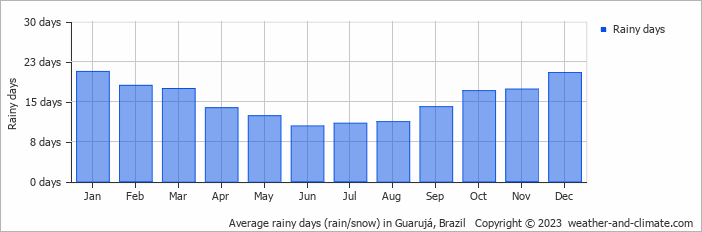
Significant seasonal changes in precipitation occur throughout the year. During the wettest month, January receives substantial rainfall, averaging 241 mm (9.5 in) of precipitation, recorded across 21 rainy days.
In contrast, the driest month, August brings less rainfall, with 98 mm (3.9 in) over 11 rainy days.
January, the wettest month, has a maximum daytime temperature of 28°C (82°F). The city receives 157 hours of sunshine in this period. During the driest month August you can expect a temperature of 23°C (73°F). For more detailed insights into the city's temperatures, visit our Guarujá Temperature page.
Daily Historical Precipitation
Average daily rainfall for each day of the month based on long-term records. 50-year average (1976-2025)
Average precipitation in July
Explore Guarujá's Historical Precipitation: 1976-2026
Browse day-by-day precipitation records for Guarujá spanning 51 years. Select any month and year to see actual rainfall and snowfall recorded on each day.
Annual Rainfall in Brazil: City Comparison
The map below shows the annual precipitation across Brazil. You can also select the different months in case you are interested in a specific month.
Guarujá vs World: Rainfall Compared
Guarujá's average annual precipitation is 1980 mm (78 in). Let's compare this to some popular worldwide tourist destinations:
The city of Rome, Italy, has an average annual precipitation of 832 mm (33 in), spread fairly evenly throughout the year.
Osaka, Japan, experiences 1507 mm (59 in) of rainfall annually, spread across the year with wetter summers.
In Tokyo, Japan, the average annual precipitation is 1528 mm (60 in), with significant summer rains due to typhoon season.
Singapore, situated near the equator, gets 2581 mm (102 in) of rainfall annually, with no distinct dry season and consistent monthly precipitation.
Precipitation amounts are measured using specific gauges installed at weather stations, collecting both rain and snow and any other type of precipitation. Rainfall is measured directly in millimeters, while that from snow and ice is obtained by melting it. Automated systems often incorporate heaters to make this easier.
Information from these stations is transmitted via Wi-Fi, satellite, GPS, or telephone connections to central monitoring networks. This information is immediately updated and integrated into weather models and forecasts.
- Mawsynram in India is noted as being the wettest place on earth, with over 11 meters (36 feet) of rain falling every year.
- In contrast, Antofagasta in Chile is among the driest places on the planet, getting less than 0.1mm (0.004 inches) per year, with some years recording virtually no rainfall.
- Nearly 1,650 thunderstorm cells are estimated over the planet at any given time.
For more detailed information about Guarujá's weather, including sunshine hours, humidity levels, and temperature data, visit our Guarujá Climate page.
Guarujá Weather by Month
Pick a month to see the average temperature, rainfall and sunshine in Guarujá - and find the best time to visit.
Guarujá 3-Day Forecast
Temperature Rainfall Sunshine Humidity
See the full Guarujá climate overview or explore weather in Brazil.
Popular this month
Where to go in July - average daytime high across popular destinations.
Bucket list
Need travel inspiration? Check out our bucket list articles and be inspired.
 The 10 most alternative cities in South America
Discover South America's top 10 alternative cities! From Valparaíso's vibrant streets to La Paz's high-altitude charm and Medellín's innovative spirit.
 The 5 most tranquil retreats in the Amazon Rainforest, Brazil
Discover top sustainable lodges in the Amazon. Enjoy unique wildlife, eco-friendly stays, and immersive experiences at Anavilhanas, Cristalino, and more.
An alternative way to discover Rio de Janeiro
Don't feel like seeing the traditional tourist sights in Rio de Janeiro? We have made an overview of the sights in Rio de Janeiro that you must see if you want to visit Rio in an alternative way.
Iguazu Falls
Iguazu Falls are among the largest waterfalls on earth. You will be speechless when you see this miracle of mother nature. They are included in the World Heritage List and have also been named one of the seven wonders of the world.