


















 Best Spring Break Destinations for Great Weather and Fewer Crowds
Skip crowded spring break resorts. Compare March weather and travel style in Puerto Escondido, San Juan del Sur, Roatán, Caye Caulker and Curaçao.
This page shows both the average monthly rainfall and the number of rainy days in Good Living Camp, Cayo, Belize. The numbers reflect climate data gathered over a 30-year period, from 1990 to 2020. Now, let's break down all the details for a clearer picture.
Good Living Camp has a relatively rainy climate with high precipitation levels, averaging 1727 mm (68 in) of rainfall annually. Despite the high annual total, it does experience a distinct rainy season during certain months. Examine our detailed charts below to understand these seasonal patterns.
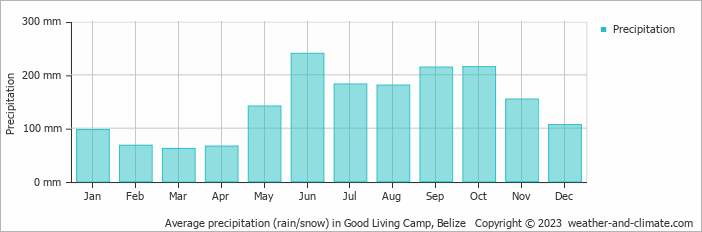
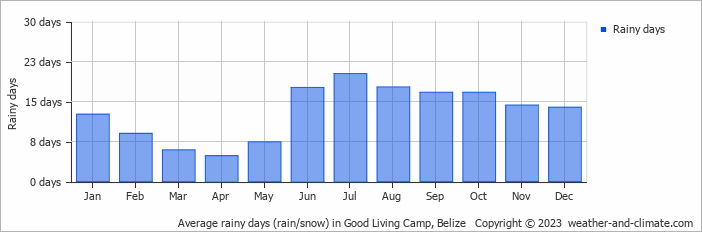
Significant seasonal changes in precipitation occur throughout the year. During the wettest month, June receives substantial rainfall, averaging 240 mm (9.4 in) of precipitation, recorded across 18 rainy days.
In contrast, the driest month, March brings less rainfall, with 62 mm (2.4 in) over 6 rainy days.
June, the wettest month, has a maximum daytime temperature of 31°C (88°F). The city receives 190 hours of sunshine in this period. During the driest month March you can expect a temperature of 30°C (86°F). For more detailed insights into the city's temperatures, visit our Good Living Camp Temperature page.
Average daily rainfall for each day of the month based on long-term records. 41-year average (1976-2025)
Browse day-by-day precipitation records for Good Living Camp spanning 51 years. Select any month and year to see actual rainfall and snowfall recorded on each day.
The map below shows the annual precipitation across Belize. You can also select the different months in case you are interested in a specific month.
Good Living Camp's average annual precipitation is 1727 mm (68 in). Let's compare this to some popular worldwide tourist destinations:
In Barcelona, Spain, the average annual precipitation is 620 mm (24 in), evenly distributed across the year with no extreme wet or dry seasons.
Meanwhile, Buenos Aires, Argentina, enjoys a humid subtropical climate with 1000 mm (39 in) of annual rainfall, mostly in the summer.
Perth, Australia, receives 565 mm (22 in) of rainfall annually, mostly during the winter months.
Singapore, situated near the equator, gets 2581 mm (102 in) of rainfall annually, with no distinct dry season and consistent monthly precipitation.
Precipitation amounts are measured using specific gauges installed at weather stations, collecting both rain and snow and any other type of precipitation. Rainfall is measured directly in millimeters, while that from snow and ice is obtained by melting it. Automated systems often incorporate heaters to make this easier.
Information from these stations is transmitted via Wi-Fi, satellite, GPS, or telephone connections to central monitoring networks. This information is immediately updated and integrated into weather models and forecasts.
Precipitation has a very strong role in determining the local climate and ecosystem:
For more detailed information about Good Living Camp's weather, including sunshine hours, humidity levels, and temperature data, visit our Good Living Camp Climate page.
Pick a month to see the average temperature, rainfall and sunshine in Good Living Camp - and find the best time to visit.
Temperature Rainfall Sunshine
See the full Good Living Camp climate overview or explore weather in Belize.
Where to go in October - average daytime high across popular destinations.
San Ignacio 31°C (88°F) Dangriga30°C (86°F) Belize City30°C (86°F) Hopkins30°C (86°F) Maya Beach30°C (86°F) Caye Caulker30°C (86°F) Placencia Village30°C (86°F) San Pedro29°C (84°F)
 Need travel inspiration? Check out our bucket list articles and be inspired.
Best Spring Break Destinations for Great Weather and Fewer Crowds
Skip crowded spring break resorts. Compare March weather and travel style in Puerto Escondido, San Juan del Sur, Roatán, Caye Caulker and Curaçao.
 Cockscomb basin wildlife sanctuary
The Cockscomb Basin Wildlife Sanctuary is located in the south of Belize and is said to be the best place on earth to encounter a jaguar. Something you migh want to add to your bucket list.
 Dive and feel like Robinson Crusoe at Glover’s Reef
Belize has an amazing number of beautiful small islands. Many of these islands are unaffordable for the average backpacker. Glovers Reef is an exception to this.
 River Tube in Belize
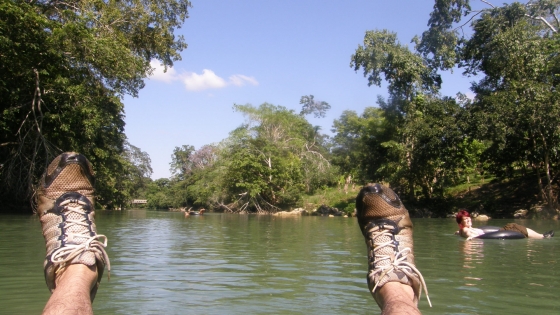
The best time to visit Belize and to River Tube is from December to mid-April, this is the dry season. If you like to avoid the crowds we recommend visiting May and early June.