Gdynia Monthly Rainfall & Precipitation
This page shows both the average monthly rainfall and the number of rainy days in Gdynia, Pomerania, Poland. These averages rely on historical data collected over 30 years, from 1990 to 2020. Let's explore the details to provide you with a complete overview.
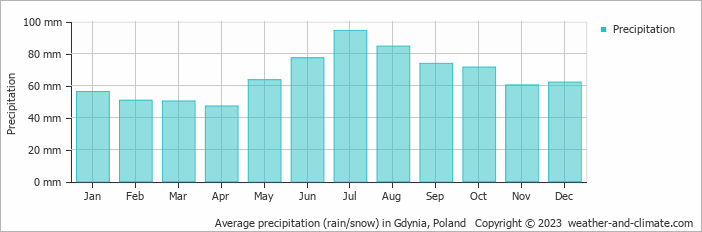
Generally, Gdynia receives mid-range precipitation levels, with 791 mm (31 in) annually.
Monthly Precipitation Levels
The average number of days each month with precipitation (> 0.2 mm (0.01 in))
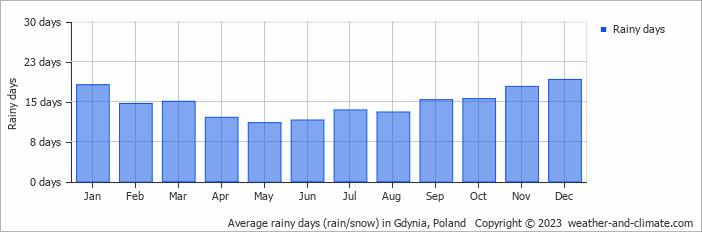
While rainfall varies throughout the year, each season offers its own charm. July brings wetter days averaging 94 mm (3.7 in) of precipitation, spread over 13 rainy days.
In contrast, April experiences a drier climate, with about 47 mm (1.9 in) of rainfall spread across 12 rainy days.
July, the wettest month, has a maximum daytime temperature of 22°C (72°F). During the driest month April you can expect a temperature of 11°C (52°F). For more detailed insights into the city's temperatures, visit our Gdynia Temperature page.
Daily Historical Precipitation
50-year average (1976-2025)
Average daily rainfall for each day of the month based on long-term records.
Average precipitation in June
Explore Gdynia's Historical Precipitation: 1976-2026
Browse day-by-day precipitation records for Gdynia spanning 51 years. Select any month and year to see actual rainfall and snowfall recorded on each day.
Annual Rainfall in Poland: City Comparison
The map below shows the annual precipitation across Poland. You can also select the different months in case you are interested in a specific month.
 heavy rainfall
 high
high
 moderate
 low
low
 almost none
Gdynia vs World: Rainfall Compared
Gdynia's average annual precipitation is 791 mm (31 in). Let's compare this to some popular worldwide tourist destinations:
In Barcelona, Spain, the average annual precipitation is 620 mm (24 in), evenly distributed across the year with no extreme wet or dry seasons.
Meanwhile, Buenos Aires, Argentina, enjoys a humid subtropical climate with 1000 mm (39 in) of annual rainfall, mostly in the summer.
Perth, Australia, receives 565 mm (22 in) of rainfall annually, mostly during the winter months.
Mumbai, India, experiences a tropical monsoon climate with 1860 mm (73 in) of annual rainfall, with the majority of precipitation happening during the monsoon season from June to September.
Precipitation amounts are measured using specific gauges installed at weather stations, collecting both rain and snow and any other type of precipitation. Rainfall is measured directly in millimeters, while that from snow and ice is obtained by melting it. Automated systems often incorporate heaters to make this easier.
Information from these stations is transmitted via Wi-Fi, satellite, GPS, or telephone connections to central monitoring networks. This information is immediately updated and integrated into weather models and forecasts.
Tropical Rainforests: In tropical regions, rainfall is generally abundant year-round. Areas near the equator, like the Amazon rainforest, can receive up to 3000 mm (118 in) of rain annually.
Desert Regions: Deserts such as the Sahara and Arabian deserts typically see less than 250 mm (9.8 in) of rainfall annually. Rainfall tends to be infrequent, but when it does occur, it is often intense.
Temperate Zones: In temperate regions, precipitation tends to be more evenly distributed, though areas closer to the ocean may see more rain in the winter months, and areas further inland experience drier summers.
Polar Regions: Precipitation in polar regions, like Antarctica, is extremely low, often falling as snow. Average annual precipitation in Antarctica is less than 200 mm (7.9 in), with some areas receiving as little as 50 mm (2 in) annually.
- The U.S. has a significant number of thunderstorms every year, with over 14.6 million taking place across the world annually.
- Approximately 70% of lightning bolts strike land rather than oceans.
- A storm named John was the longest-lasting Pacific tropical storm, continuing for 31 days. As it crossed the dateline twice, it changed status from a hurricane to a typhoon and back to a hurricane.
For more detailed information about Gdynia's weather, including sunshine hours, humidity levels, and temperature data, visit our Gdynia Climate page.


