

















 Do a pub crawl in Antwerp
You can visit Antwerp year round however May through September is the best time to go to Antwerp for a pub crawl. Late spring is recommended for its long days.
This page shows both the average monthly rainfall and the number of rainy days in Falmignoul, Namur Province, Belgium. This average is based on long-term data collected between 1990 and 2020. Now, let's break down all the details for a clearer picture.
On average, Falmignoul receives a reasonable amount of rain/snowfall, with an annual precipitation of 933 mm (37 in).
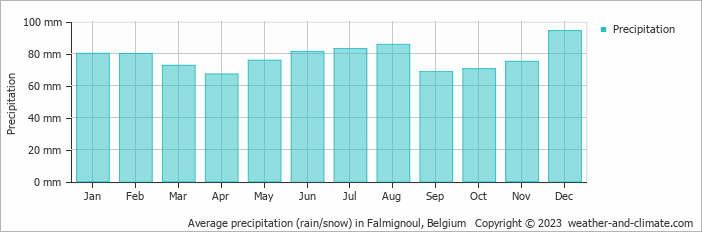
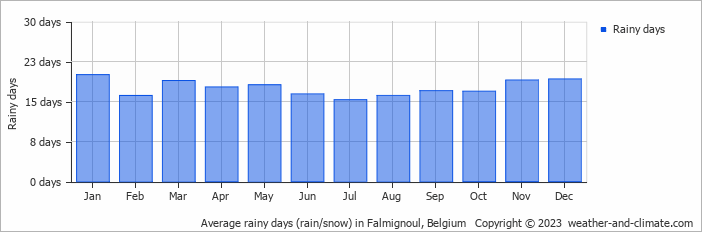
Precipitation levels in Falmignoul remain relatively steady throughout the year. December has the most rain, with 94 mm (3.7 in) over 19 days. In April, this drops slightly to 67 mm (2.6 in), making the city's climate fairly predictable.
December, the wettest month, has a maximum daytime temperature of 7°C (45°F). The city receives 37 hours of sunshine in this period. During the driest month April you can expect a temperature of 15°C (59°F). For more detailed insights into the city's temperatures, visit our Falmignoul Temperature page.
The map below shows the annual precipitation across Belgium. You can also select the different months in case you are interested in a specific month.
Falmignoul's average annual precipitation is 933 mm (37 in). Let's compare this to some popular worldwide tourist destinations:
In Barcelona, Spain, the average annual precipitation is 644 mm (25 in), evenly distributed across the year with no extreme wet or dry seasons.
Meanwhile, Buenos Aires, Argentina, enjoys a humid subtropical climate with 1000 mm (39 in) of annual rainfall, mostly in the summer.
In Tokyo, Japan, the average annual precipitation is 1528 mm (60 in), with significant summer rains due to typhoon season.
Mumbai, India, experiences a tropical monsoon climate with 1860 mm (73 in) of annual rainfall, with the majority of precipitation happening during the monsoon season from June to September.
Precipitation amounts are measured using specific gauges installed at weather stations, collecting both rain and snow and any other type of precipitation. Rainfall is measured directly in millimeters, while that from snow and ice is obtained by melting it. Automated systems often incorporate heaters to make this easier.
Information from these stations is transmitted via Wi-Fi, satellite, GPS, or telephone connections to central monitoring networks. This information is immediately updated and integrated into weather models and forecasts.
For more detailed information about Falmignoul's weather, including sunshine hours, humidity levels, and temperature data, visit our Falmignoul Climate page.
Pick a month to see the average temperature, rainfall and sunshine in Falmignoul - and find the best time to visit.
Temperature Rainfall Sunshine
See the full Falmignoul climate overview or explore weather in Belgium.
Where to go in September - average daytime high across popular destinations.
Ghent 21°C (70°F) Brussels21°C (70°F) Antwerp21°C (70°F) Bruges20°C (68°F) Blankenberge
 20°C (68°F) Knokke-Heist20°C (68°F) Durbuy19°C (66°F) Ostend19°C (66°F)
 Need travel inspiration? Check out our bucket list articles and be inspired.
Do a pub crawl in Antwerp
You can visit Antwerp year round however May through September is the best time to go to Antwerp for a pub crawl. Late spring is recommended for its long days.
 Discover the green beauty of Belgium's Ardennes
Uncover Belgium's Ardennes: Outdoor adventures, history, relaxation, and local delights await in this green travel paradise

 The 10 most charming villages in France
Discover France's top 10 beautiful villages. From Normandy to the Côte d'Azur, experience quaint squares and cobbled streets. Which one will you visit this summer?
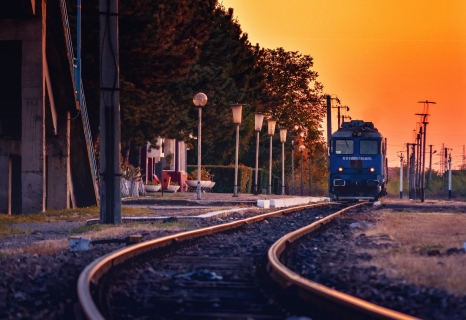
 The train journey from Bucharest to Brasov is one of the most beautiful in Romania
In three hours, you'll get from Bucharest to Brasov by train. It is one of the most beautiful routes in Romania, certainly the most beautiful that can be done by express train.