

















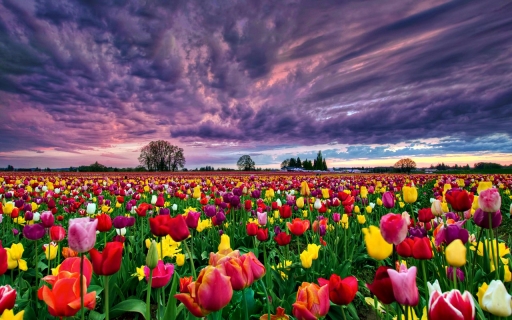
 Flower fields in the Netherlands
The flower fields in The Netherlands are world famous. The red, pink and yellow colors are breathtakingly beautiful and should be on the bucket list.
This page shows both the average monthly rainfall and the number of rainy days in De Bult, Overijssel, Netherlands. The figures are based on a 30-year period (1990–2020) to provide a reliable average. Let's now guide you through the details for a complete overview.
Generally, De Bult experiences moderate precipitation patterns, averaging 860 mm (34 in) yearly.
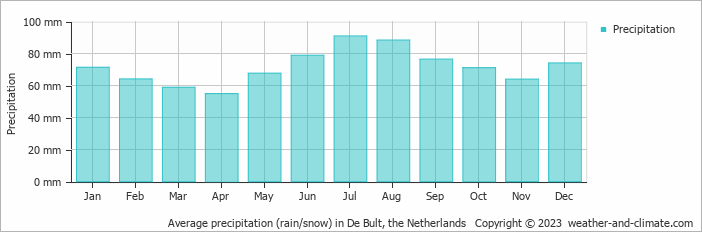
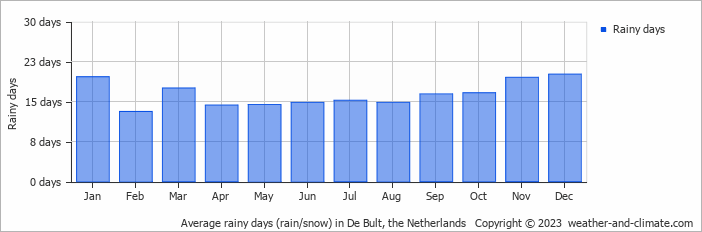
De Bult experiences moderate seasonal variation in rainfall, with monthly averages ranging from 91 mm (3.6 in) in July, the wettest month, and 55 mm (2.2 in) in April, the driest month.
July, the wettest month, has a maximum daytime temperature of 23°C (73°F). The city receives 189 hours of sunshine in this period. During the driest month April you can expect a temperature of 15°C (59°F). For more detailed insights into the city's temperatures, visit our De Bult Temperature page.
Average daily rainfall for each day of the month based on long-term records. 50-year average (1976-2025)
Browse day-by-day precipitation records for De Bult spanning 51 years. Select any month and year to see actual rainfall and snowfall recorded on each day.
The map below shows the annual precipitation across the Netherlands. You can also select the different months in case you are interested in a specific month.
De Bult's average annual precipitation is 860 mm (34 in). Let's compare this to some popular worldwide tourist destinations:
Boston, USA, experiences 1238 mm (49 in) of annual precipitation, including significant snowfall during the winter.
Meanwhile, Buenos Aires, Argentina, enjoys a humid subtropical climate with 1000 mm (39 in) of annual rainfall, mostly in the summer.
Melbourne, Australia, has 690 mm (27 in) of rainfall annually, spread fairly evenly throughout the year.
Mumbai, India, experiences a tropical monsoon climate with 1860 mm (73 in) of annual rainfall, with the majority of precipitation happening during the monsoon season from June to September.
Precipitation amounts are measured using specific gauges installed at weather stations, collecting both rain and snow and any other type of precipitation. Rainfall is measured directly in millimeters, while that from snow and ice is obtained by melting it. Automated systems often incorporate heaters to make this easier.
Information from these stations is transmitted via Wi-Fi, satellite, GPS, or telephone connections to central monitoring networks. This information is immediately updated and integrated into weather models and forecasts.
The proximity of a location to a large body of water can significantly affect its rainfall patterns:
For more detailed information about De Bult's weather, including sunshine hours, humidity levels, and temperature data, visit our De Bult Climate page.
Pick a month to see the average temperature, rainfall and sunshine in De Bult - and find the best time to visit.
Temperature Rainfall Sunshine Humidity
See the full De Bult climate overview or explore weather in the Netherlands.
Where to go in September - average daytime high across popular destinations.
Valkenburg 20°C (68°F) Utrecht20°C (68°F) Maastricht20°C (68°F) Noordwijk aan Zee
 19°C (66°F) Rotterdam20°C (68°F) Zandvoort
 19°C (66°F) The Hague20°C (68°F) Amsterdam19°C (66°F)
 Need travel inspiration? Check out our bucket list articles and be inspired.
Flower fields in the Netherlands
The flower fields in The Netherlands are world famous. The red, pink and yellow colors are breathtakingly beautiful and should be on the bucket list.
 Pride in Amsterdam
Nowhere in the world is Pride being celebrated on the water on such a scale as in Amsterdam. It is an unique experience that every person needs to add to his, her or its bucket list.
 The greenest experience of Amsterdam
If you’re looking for an experience of Amsterdam that is rooted in nature, that can help you go outside and get your hands dirty, then these tips are for you.
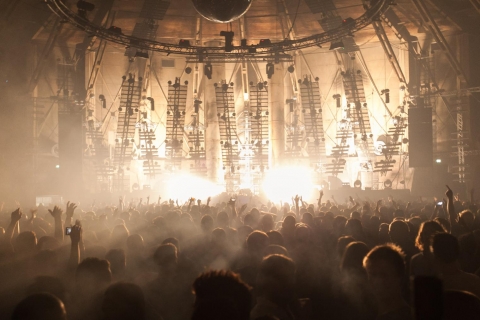 Amsterdam Dance Event
ADE is one of the larger festival giants, but you may never have heard of it if you are not an electronic music fan. It last five days and takes place in October.