















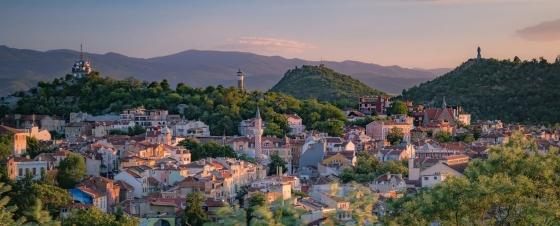
 7 of the most budget-friendly destinations in Europe
Discover Europe's top budget-friendly destinations including Budapest, Kotor, Krakow, and more, perfect for affordable and exciting travel.
This page shows both the average monthly rainfall and the number of rainy days in Česká Ves, Olomouc Region, Czech Republic. The numbers reflect climate data gathered over a 30-year period, from 1990 to 2020. Now, let's break down all the details for a clearer picture.
Česká Ves has a relatively rain/snowy climate with high precipitation levels, averaging 1004 mm (40 in) of rain/snowfall annually.
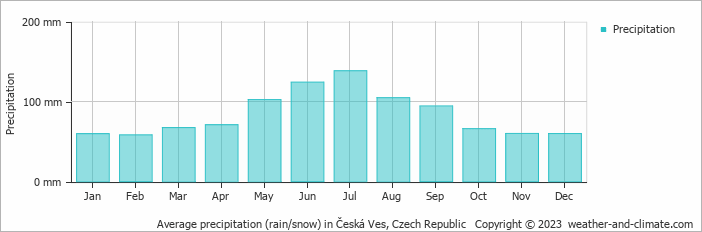
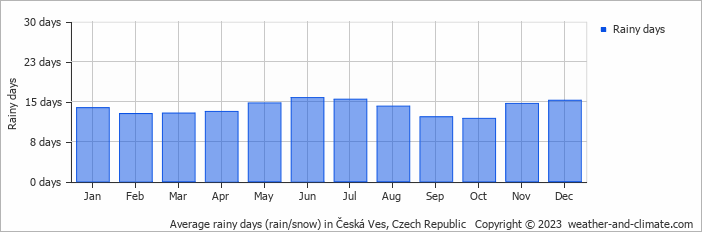
The seasons in Česká Ves, bring significant changes in precipitation. The wettest month, July, receives high rainfall, with an average of 138 mm (5.4 in) of precipitation. This rainfall is distributed across 15 rainy days.
In contrast, the driest month, February, experiences much less snow/rainfall, totaling 58 mm (2.3 in) over 13 snowy/rainy days. These distinct seasonal differences provide diverse experiences throughout the year.July, the wettest month, has a maximum daytime temperature of 23°C (73°F). The city receives 231 hours of sunshine in this period. During the driest month February you can expect a temperature of 2°C (36°F). For more detailed insights into the city's temperatures, visit our Česká Ves Temperature page.
The map below shows the annual precipitation across Czech Republic. You can also select the different months in case you are interested in a specific month.
Česká Ves's average annual precipitation is 1004 mm (40 in). Let's compare this to some popular worldwide tourist destinations:
The city of Rome, Italy, has an average annual precipitation of 832 mm (33 in), spread fairly evenly throughout the year.
Osaka, Japan, experiences 1507 mm (59 in) of rainfall annually, spread across the year with wetter summers.
Adelaide, Australia, enjoys 511 mm (20 in) of annual precipitation, with dry summers and wet winters.
Kuala Lumpur, Malaysia, receives 2529 mm (100 in) of annual rainfall, characteristic of its equatorial tropical rainforest climate, with consistent rainfall throughout the year and peak months during March and November.
Precipitation amounts are measured using specific gauges installed at weather stations, collecting both rain and snow and any other type of precipitation. Rainfall is measured directly in millimeters, while that from snow and ice is obtained by melting it. Automated systems often incorporate heaters to make this easier.
Information from these stations is transmitted via Wi-Fi, satellite, GPS, or telephone connections to central monitoring networks. This information is immediately updated and integrated into weather models and forecasts.
Precipitation has a very strong role in determining the local climate and ecosystem:
For more detailed information about Česká Ves's weather, including sunshine hours, humidity levels, and temperature data, visit our Česká Ves Climate page.
Pick a month to see the average temperature, rainfall and sunshine in Česká Ves - and find the best time to visit.
Temperature Rainfall Sunshine Humidity
See the full Česká Ves climate overview or explore weather in Czech Republic.
Where to go in October - average daytime high across popular destinations.
 Prague
 14°C (57°F) Brno
 14°C (57°F) Mariánské Lázně13°C (55°F) Český Krumlov13°C (55°F) Rokytnice nad Jizerou11°C (52°F) Karlovy Vary
 12°C (54°F) Špindlerův Mlýn11°C (52°F) Harrachov11°C (52°F)
 Need travel inspiration? Check out our bucket list articles and be inspired.
7 of the most budget-friendly destinations in Europe
Discover Europe's top budget-friendly destinations including Budapest, Kotor, Krakow, and more, perfect for affordable and exciting travel.
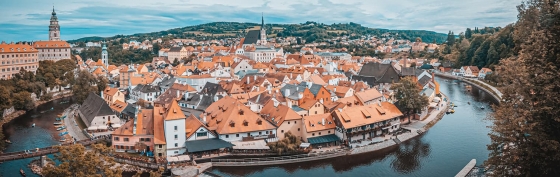 A magical trip to the fairytale town of Cesky Krumlov
Cesky Krumlov is as magical and beautiful as a storybook one. If you love castles and cobbled streets, this town is perfect for a getaway for you.
 Karlovy Vary: The Timeless Elegance of a Premier Spa Town
Karlovy Vary, a historic spa town in Bohemia known for its elegant 19th-century architecture, famous hot springs, and rich cultural heritage.

 The 10 most charming villages in France
Discover France's top 10 beautiful villages. From Normandy to the Côte d'Azur, experience quaint squares and cobbled streets. Which one will you visit this summer?