


















 The 10 most alternative cities in South America
Discover South America's top 10 alternative cities! From Valparaíso's vibrant streets to La Paz's high-altitude charm and Medellín's innovative spirit.
This page shows both the average monthly rainfall and the number of rainy days in Cajicá, Cundinamarca, Colombia. These averages rely on historical data collected over 30 years, from 1990 to 2020. Let's now guide you through the details for a complete overview.
Cajicá is known for its substantial rainfall, with annual precipitation reaching 1544 mm (61 in).
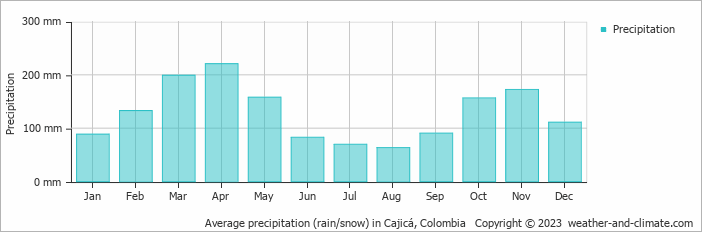
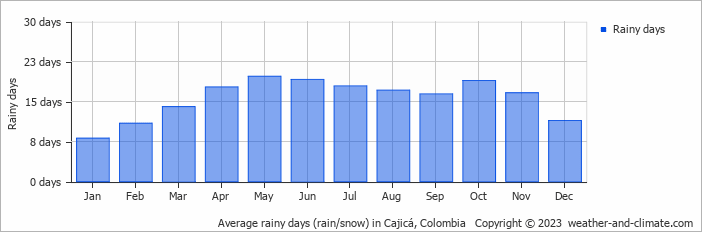
Cajicá can be quite wet during April, receiving approximately 221 mm (8.7 in) of precipitation over 18 rainy days.
In contrast August, experiences much drier conditions, with 63 mm (2.5 in) of rainfall, spread across 17 rainy days.
April, the wettest month, has a maximum daytime temperature of 20°C (68°F). The city receives 88 hours of sunshine in this period. During the driest month August you can expect a temperature of 20°C (68°F). For more detailed insights into the city's temperatures, visit our Cajicá Temperature page.
The map below shows the annual precipitation across Colombia. You can also select the different months in case you are interested in a specific month.
Cajicá's average annual precipitation is 1544 mm (61 in). Let's compare this to some popular worldwide tourist destinations:
New York City, USA, receives 1276 mm (50 in) of rainfall annually, with precipitation evenly distributed throughout the year.
In Shanghai, China, the annual average precipitation is 1347 mm (53 in), with a humid subtropical climate.
Melbourne, Australia, has 690 mm (27 in) of rainfall annually, spread fairly evenly throughout the year.
Singapore, situated near the equator, gets 2581 mm (102 in) of rainfall annually, with no distinct dry season and consistent monthly precipitation.
Precipitation amounts are measured using specific gauges installed at weather stations, collecting both rain and snow and any other type of precipitation. Rainfall is measured directly in millimeters, while that from snow and ice is obtained by melting it. Automated systems often incorporate heaters to make this easier.
Information from these stations is transmitted via Wi-Fi, satellite, GPS, or telephone connections to central monitoring networks. This information is immediately updated and integrated into weather models and forecasts.
For more detailed information about Cajicá's weather, including sunshine hours, humidity levels, and temperature data, visit our Cajicá Climate page.
Pick a month to see the average temperature, rainfall and sunshine in Cajicá - and find the best time to visit.
Temperature Rainfall Sunshine Humidity
See the full Cajicá climate overview or explore weather in Colombia.
Where to go in October - average daytime high across popular destinations.
 Cartagena
 30°C (86°F) San Andrés29°C (84°F) Santa Marta29°C (84°F) Cali27°C (81°F) Medellín24°C (75°F) Pereira24°C (75°F) Villa de Leyva20°C (68°F) Bogotá21°C (70°F)
 Need travel inspiration? Check out our bucket list articles and be inspired.
The 10 most alternative cities in South America
Discover South America's top 10 alternative cities! From Valparaíso's vibrant streets to La Paz's high-altitude charm and Medellín's innovative spirit.
 5 Hidden Gems in Colombia
Explore Colombia's hidden gems, from El Cocuy's remote beauty to Providencia's serene beaches, offering authentic experiences off the beaten path.
 Tayrona National Park: the most beautiful part of Colombia
Visit the park between the months December and March (not February since it is closed) or from June till August (this is high season).
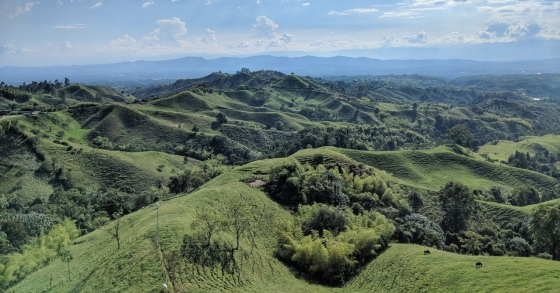 Breathtaking view in Minca
Minca is a tiny village in the tropical rain forest of Colombia and is an oasis of tranquility. Everyone looking for a relatively undiscovered piece of Colombia is in the right place here.